HEDDA.IO is at the forefront of data quality management with its innovative Preview feature, which transforms the way businesses interact with their data.
This powerful tool is crafted to give users the ability to inspect samples or entire datasets within the operational context of their Knowledge Base, all without departing from the HEDDA.IO Frontend environment. It’s not just about glimpsing into your data; it’s about experiencing it in action, observing how it behaves under various business rules and scenarios before committing to a full-scale process.
This Preview functionality is ingeniously simple yet incredibly powerful. It executes directly on a Data Link table that references your chosen dataset, employing a Mapping linked to a specific Run. This Run is where all the execution statistics are meticulously recorded. The outcome is a neatly arranged table, showcasing your data as it will appear post-processing. To enhance the user experience, a dynamic toolbar allows for the application of diverse filters, offering a granular level of control and enabling users to fine-tune their view of the processed data.
Practical Use Case
In the real world, data professionals often grapple with large volumes of data, and ensuring its quality can be an arduous task. The configuration of a multitude of dataset parameters and business rules can be overwhelming. HEDDA.IO’s Preview feature is designed to alleviate this burden by allowing you to periodically inspect the data as it will appear once processed. This capability is crucial when you’re configuring an extensive array of rules and need to verify the performance of HEDDA.IO, ensuring that the results are accurate and consistent with your expectations.
The practicality of HEDDA.IO’s Preview is evident in its setup. You can establish a Data Link table that references a subset of your source dataset, alongside a Run designated for this previewing purpose. This approach is seamless and efficient, allowing you to evaluate the execution against your Knowledge Base quickly. It’s a proactive solution that ensures your configurations are precise, error-free, and that the processed data faithfully represents the expected outcomes. This strategic previewing acts as a safeguard, a quality check that aligns your data with the high standards you’ve set.
Convenient Access to Preview Features
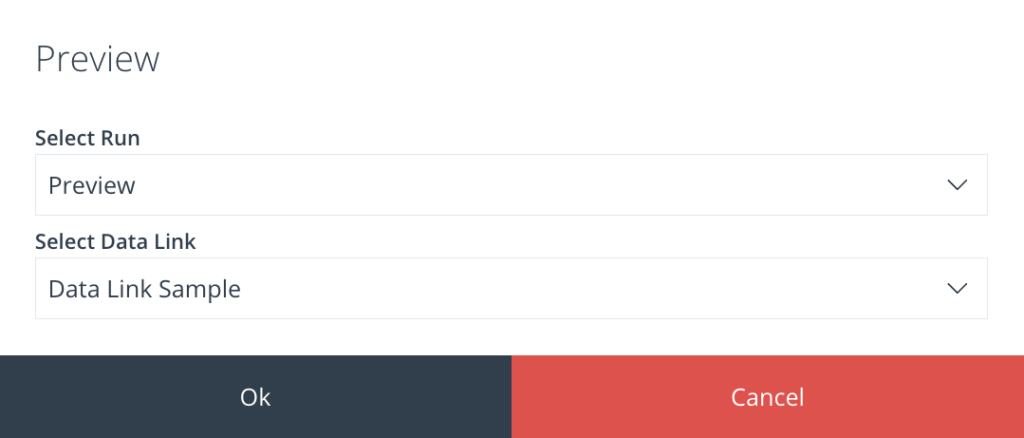
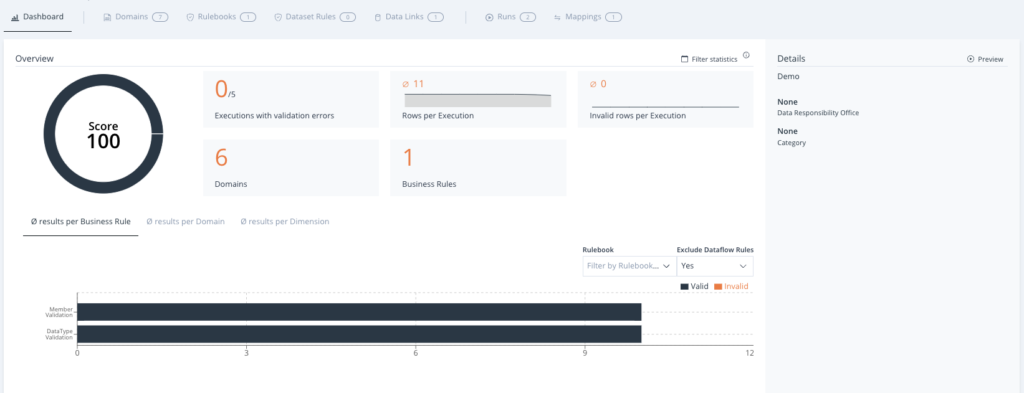
HEDDA.IO has been developed with user-friendliness in mind, particularly evident in how one accesses the Preview feature. The Knowledge Base Dashboard is designed to be intuitive, with the Preview button located within easy reach in the Info Panel’s top-right corner. Initiating the Preview is as simple as a button click, which then prompts you to select from predefined Runs and Lookups, effectively tailoring the Preview to your immediate requirements.

Upon activation, a window materialises, presenting the processed data in a format ready for your examination. It’s a seamless transition from selection to insight, illustrating HEDDA.IO’s commitment to a streamlined user experience.
Robust Data Viewing and Analysis Tools
Once you’re in the Preview menu, HEDDA.IO offers a suite of tools for in-depth data navigation and analysis. The interface is designed for ease of use, featuring filters to refine the dataset display, making it an indispensable tool for data professionals. Whether you’re focused on isolating specific rows based on their validity or interested in understanding the implications of corrections applied, the toolbar facilitates your analysis with precision.
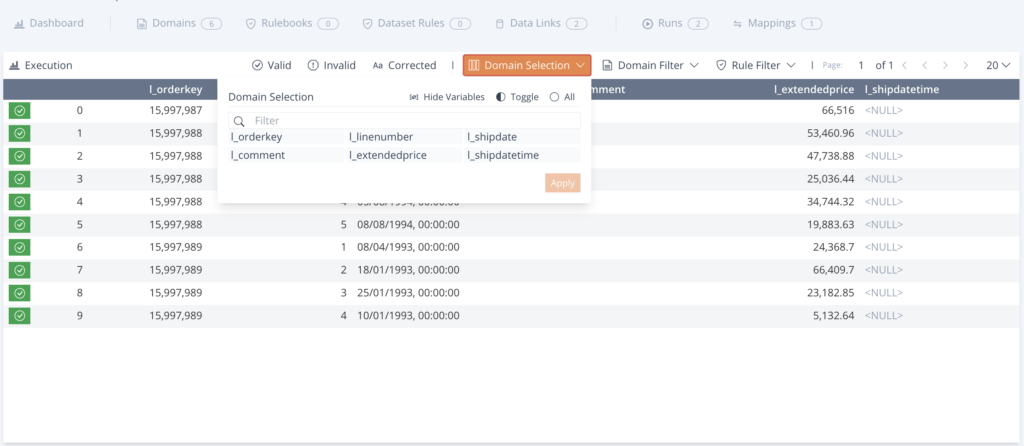
Furthermore, accessing statistical information is just a click away. This quick access to data performance metrics allows users to gauge the effectiveness of their business rules and data configurations on the fly. It’s an integrated approach to data management, where every tool and feature is positioned to provide maximum insight and value.
HEDDA.IO also offers the flexibility to retrospectively examine the data from past executions, provided they are tagged with the “Has Data” label. This retrospective analysis is crucial for comparing current data configurations with historical ones, ensuring that any modifications or updates to your business rules are producing the desired effect over time.
How exactly does it work?
1. Create an External Connection to the Data
External Connections provide you with the capability to establish links to external database services of different types, including Azure Storage, Microsoft SQL Server, and Reference Data Service. These connections can be currently utilised to create Lookups or to import Members into a Domain from an external dataset.

2. Configure Your Knowledge Base
Knowledge Bases are entities responsible for containing comprehensive information about the structure of your data, the regulations it needs to adhere to, Execution metrics, and a variety of additional details that we will cover further in the Concepts section.
A guide on where to find, how to navigate, and how to add Knowledge Bases within the HEDDA.IO user interface, is available here.
3. Create a Data Link
Data Links play a crucial role in HEDDA.IO. These are operations that involve retrieving relevant data from a reference data source based on shared identifiers to also supplement information in a dataset.

4. Create a Run
Within the HEDDA.IO application, a Run is simply a container in which Executions and their respective Statistics are stored. Runs add context to executions so that you can then easily locate the statistics linked to respective executions, whenever you need.
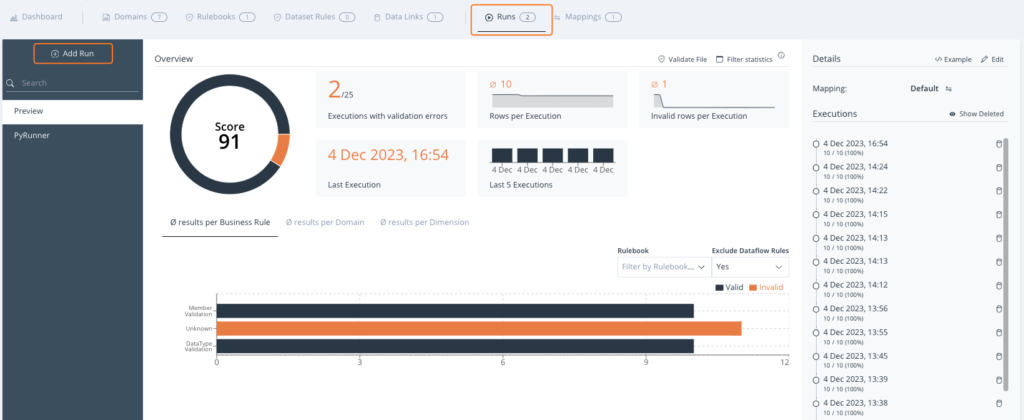
5. Launch Preview
The Knowledge Base Dashboard provides access to the Preview button. In the top-right corner of the Info Panel on the right, you’ll locate the Preview button.
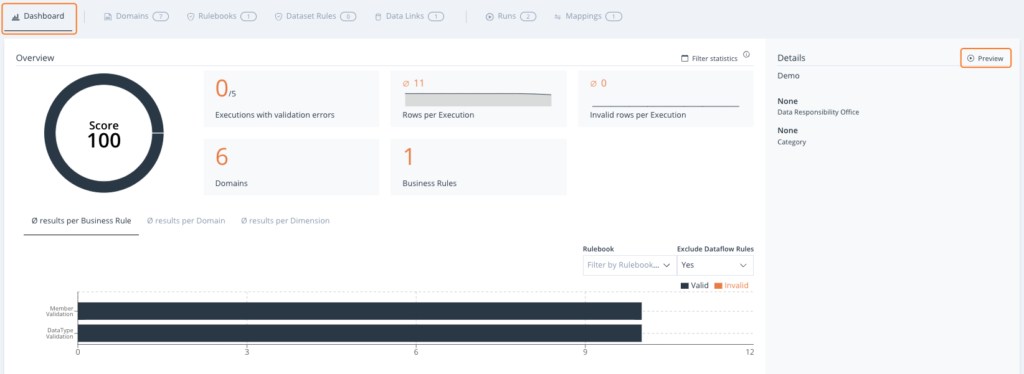
Upon clicking the button, a window will appear, prompting you to select a Run and a Lookup. After selecting these, click OK to initiate the Preview.

This action triggers a HEDDA.IO execution on the chosen Lookup, followed by the opening of the Preview menu. Here, you can examine the data processed by HEDDA.IO.
Detailed Examination with the Preview Panel
The Preview panel is not just a visual aid; it’s a comprehensive data examination platform. Here, every row of data is tagged with color-coded validation status indicators, serving as gateways to deeper analysis.
Clicking on these indicators unfolds the Row Result panel, which offers a wealth of information. You get a domain-by-domain breakdown, showcasing current and original values, and any modifications are highlighted for quick reference.
Moreover, the Row Result panel is where the intricate dance of data and rules becomes clear. Hovering over a domain that has undergone changes during execution brings up an Info Icon. Clicking on this icon reveals the specific Last Rule and Rulebook involved, offering transparency and traceability. This detailed analysis is complemented by an overview of the overall validation status and an interactive exploration of each Rulebook involved in the data checking process.
Conclusion
HEDDA.IO’s Preview feature is a testament to the platform’s sophistication and commitment to data quality. With the ability to dive into the specifics of each data row, coupled with the power to assess the effectiveness of business rules in real-time, HEDDA.IO is setting a new standard for data management platforms.
