END USER
DOCUMENTATION.
Concepts
Projects
Projects are essentially workspaces within HEDDA.IO, designed to cater to your distinct needs for utilising the HEDDA.IO platform.
Unless you have a Project established, it’s not possible to generate a Knowledge Base. As a result, initiating a Project stands as the primary step towards making use of HEDDA.IO. Here’s a guide on how to Create a Project in HEDDA.IO.
The Project page encompasses several vital Project-wide features, including External Connections, Events, and User Management. Moreover, it presents the list of Knowledge Bases and provides the capability to add new ones.
A comprehensive guide on how to navigate and create a Project in HEDDA.IO is available here.
External Connections
External Connections provide you with the capability to establish links to external database services of different types, including Azure Storage, Microsoft SQL Server, and Reference Data Service. These connections can be currently utilised to create Lookups or to import Members into a Domain from an external dataset.
A guide on where to find and how to navigate the External Connections page, as well as how to create a Connection within the HEDDA.IO user interface, is available here.
Events
Events enable you to trigger external services when specific occurrences take place. This encompasses actions like initiating an HTTP Call, dispatching an Email, generating a work item within DevOps (such as Bugs, Tasks, or Issues), or even delivering a Teams notification.
The prescribed sequence for this process involves initially setting up an Event Sink, followed by establishing an Events layered on the foundation of the sink.
Use Case
The Events system offers a diverse range of applications, and we can explore several examples.
- Generate a work item in Azure DevOps whenever there is a failure in a Dataset, Rulebook, or Business Rule.
- Transmit a payload to Events Grid or Hub upon the publication of a new version of a Knowledge Base.
- Dispatch an Email, Teams, or Slack message upon the completion of an execution.
A guide on where to find and how to navigate the Events page, as well as how to create Event Sinks and Events within the HEDDA.IO user interface, is available here.
User Management
Preventing unauthorised users from accessing Projects they shouldn’t be a part of is always a priority.
That’s why HEDDA.IO provides you with the ability to control the levels of permission users possess for various Projects within the platform, through the utilisation of the Manage Users feature. Currently, there are three available permission levels at your disposal: Read, Write, and Manage.
A guide on where to find the User Management and how to correctly manage users within the HEDDA.IO user interface, is available here.
Knowledge Bases
Knowledge Bases are entities responsible for containing comprehensive information about the structure of your data, the regulations it needs to adhere to, Execution metrics, and a variety of additional details that we will cover further in the Concepts section.
Every Knowledge Base can be configured to facilitate a workflow that could systematically processes a particular dataset associated with the Project. The Knowledge Base encompasses Domains and their corresponding Members, Rulebooks along with their associated Business Rules, Dataset Rules, Lookups, Runs accompanied by their corresponding Execution Statistics, and Mappings. Each of these components will be explored in greater detail further into the Concepts section.
You have the option to manually create a Knowledge Base, which also involves establishing the associated Domains in a similar fashion. Alternatively, a Knowledge Base can be imported from a dataset. The dataset can take the form of a Parquet file or an SQL table, and can be imported from a local environment, Azure Storage, or a Microsoft SQL Database.
A guide on where to find, how to navigate, and how to add Knowledge Bases within the HEDDA.IO user interface, is available here
The Knowledge Base can also be exported and imported, enabling seamless transfer between various Projects and even different environments altogether. Click here to find out how this can be achieved within the HEDDA.IO user interface.
Domains
In HEDDA.IO, Domains refer to the distinct columns present in your dataset, and within a Knowledge Base. They can comprise a variety of categories, each encapsulating a comprehensive set of relevant values.
In addition to manually adding Domains to a Knowledge Base, you can also import them from a dataset, which is carried out when importing the entire Knowledge Base from a dataset source. During this process, you are presented with the choice to specify which columns from the dataset should be brought in as Domains within HEDDA.IO. In such cases, the configuration attributes of these Domains, such as their names and data types, will be inherited from the data types associated with the imported columns.
Furthermore, you always retain the flexibility to modify the Domains afterwards, allowing you to fine-tune other properties. These properties encompass a description, validation Algorithms (applicable to string data types), precision and scale adjustments (pertinent to number data types), and corresponding access modifiers, among other attributes.
Domains can be marked as Variables. Variable Domains can still be used in Business Rules and Actions but will not appear in Mappings as they are not read from the Source Data. This means that they do not need to be present in eg. the source data frame. On top of this Variable Domains can also have a Default Value configured.
On Preview Screen, Variable Domains are hidden by default but can be made visible through the Domain Selection.
A guide on where to find, how to navigate, and how to add Domains within the HEDDA.IO user interface, is available here.
Members and Member Search
In HEDDA.IO, Members represent potential values expected within a Domain in your dataset. These Members are categorised into two types: Main and Synonyms. Main Members encompass the specific values desired in your processed dataset, while Synonym Members, associated with Main Members, represent likely alternative values that HEDDA.IO might encounter in the corresponding Domain.
Each Domain can contain a number of Members, and each Member has a Validation Status property that can be set to Valid or Invalid, allowing the validator to make the distinction between the valid and invalid values.
Each Member can hold multiple Synonyms. These Synonyms might include misspelled or abbreviated names, or even IDs that require substitution with their corresponding full names or vice versa. Essentially, by having Members and their associated Synonyms, you gain the capability to link a value within a column to a Synonym and subsequently substitute that value with the Main Member associated with that Synonym. This procedure is a concept is what we call a Member Search.
Enabling the Is External switch within a Domain configuration permits you to import both the Main Members and their respective Synonyms from an external dataset.
Use Case
Let’s consider a scenario where you have a column in your dataset containing payment type names, but for easier data handling, you prefer to represent them as IDs. In this setup, you designate the Main Member as the IDs and associate each Main Member with its corresponding Synonym, which is the name of the payment type.
Let’s take a look at the following table.
| ID | PaymentName |
|---|---|
| 1 | Cash |
| 2 | Credit Card |
| 3 | PayPal |
In the context of our use case and based on the provided table, you would designate each ID as the primary Member and each PaymentName as the Synonym corresponding to its respective ID. As a result, the values in this column will be transformed from PaymentName to their corresponding ID if a PaymentName matching the Synonym is encountered in your dataset’s specified column.
A guide on where to find, and how to add Members to Domains within the HEDDA.IO user interface, is available here.
Algorithms
Depending on the data utilised within your Domain, the outcomes can be significantly enhanced by selecting the appropriate algorithm. Phonetic algorithms, for instance, can be effectively employed for product names.
When dealing with product numbers in your Domain, employing a distance algorithm like Levenshtein Distance can yield positive results. However, when dealing with telephone numbers, even minor discrepancies can lead to entirely incorrect outcomes. Hence, in such cases, the optimal algorithm is an exact match.
How does HEDDA.IO uses algorithms
When you validate data against a Domain, HEDDA.IO examines whether the value is already defined as a Member for this Domain. If a match is found, HEDDA.IO will continue using the found Member instead of the original value in all following processes. Additionally, if a match is found and this match is a Synonym of a different Member, the Main Member will be used instead.
If no direct match was found, HEDDA.IO will try again to find an existing Member, based on the selected algorithm. These Algorithms include distance algorithms, Phonetic Algorithms as well as keyboard-distance Algorithms.
An overview of all the Algorithms available in HEDDA.IO can be found here.
Rulebooks and Business Rules
To further enhance the validation process for the data that is ingested, HEDDA.IO offers a feature known as Rulebooks. This serves as an encapsulation for a collection of Business Rules, enabling you to organise and arrange them in a coherent order, based on basic logical rules.
Furthermore, it provides an overview and a visual representation of the sequence of Business Rules on a canvas, allowing you to easily visualise the flow and make modifications.
Conditions and sub-conditions can be incorporated into Business Rules, allowing the utilisation of Lookup values or other Domain values to validate Domains.
Business Rules can be designated as Dataflow Rules, enabling HEDDA.IO to treat them as logical operations only. This configuration excludes them from the validation results and associated statistics, emphasising their role in data manipulation or transformation without affecting validation outcomes.
It’s essential to note that Business Rules can only be formulated within a Rulebook and must be part of the Business Rule sequence inside that Rulebook. A Rulebook can have just one Business Rule sequence, which is capable of forking any number of times.
Use Case
Let’s consider a scenario where you have two distinct sets of business rules designed to validate and/or correct data for different purposes or departments within your company. An effective approach is to create one Rulebook for the first purpose, containing the corresponding set of Business Rules. Simultaneously, you can create a second Rulebook for the business rules aligned with the other purpose. This methodology facilitates ease of modification to the Business Rules, streamlining their location. Additionally, it allows HEDDA.IO to organise statistics in a way that enables you to effortlessly extract statistics specifically related to each Rulebook.
Another use case is related to the Business Rules that are set as logical operators by enabling the Is Dataflow Rule switch.
By setting up a Rulebook with a Dataflow Rule based on the Employment Duration column, you can dynamically execute different sets of Business Rules depending on the value of that Domain. Enabling the Is Dataflow Rule switch ensures that the Dataflow Rule operates as a logical condition without impacting validation results.
For instance, in the case of employee data, having one set of rules for those with less than 10 years of employment and another set for those with 10 years and above is a practical way to tailor the data processing. The visual representation of the Rulebook, as you described, with the Dataflow Rule at the top, demonstrates a clear and effective structure for such conditional execution of Business Rules.
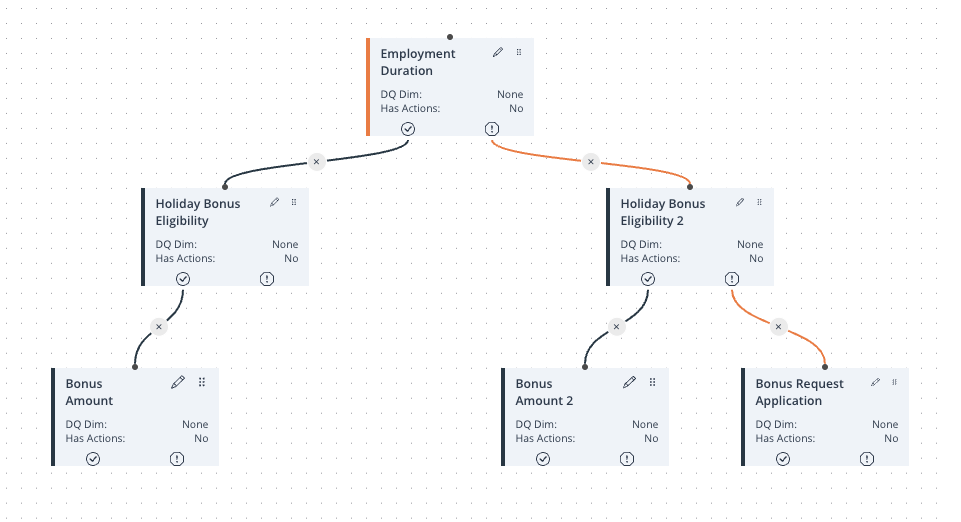
Image 1: Rulebook Canvas Example
A guide on where to find, and how to add Rulebooks and Business Rules within the HEDDA.IO user interface, is available here.
Business Rule Actions
In addition to incorporating conditions, users have the ability to integrate actions into Business Rules, which are executed when specific conditions, or sets of conditions, specified within a Business Rule are satisfied.
These action choices encompass functions like Set, Append, Prepend, Increment, Trim, and others. Domains and Lookups can also be applied in conjunction with these actions. For those with a knack for creativity, it’s possible to link multiple Actions together to mimic concatenation.
Use Case
In the context of concatenation for this use case, consider a dataset with two columns: First Name and Middle Name. The First Name column contains no null values, while the Middle Name column does have null values. If you prefer to consolidate both names into the First Name column rather than keeping them separate, you can configure a business rule.
This Business Rule would have one condition, checking whether the Middle Name column is not null, and it would include two actions. The first action would involve appending the value from the Middle Name column to the existing value in the First Name column, effectively combining them. This rule simplifies your dataset by consolidating names when a middle name is present.
- Add condition that checks if column
Middle Nameis not null. - Add action that appends a white space to the
First Namecolumn. - Add action that appends the
Middle Namevalue to theFirst Namevalue.
Further details on this are provided in the Rulebooks section for reference.
Dataset Rules
The Dataset Rules facilitate the validation of the input dataset at a broader, macro-level. Instead of individually inspecting every value within each row, these rules evaluate all the values present within a column, subjecting them to predefined conditions or a specified set of criteria.
Use Case
Let’s suppose you have a column in your dataset that may contain null values. Having null values is generally acceptable, but you have a specific threshold for the percentage of rows within that column that can contain null values. You can set up a Dataset Rule to inform you when a column contains null values exceeding the specified percentage limit. This way, you can monitor and manage null values within your dataset more effectively.
A guide on where to find, and how to add Dataset Rules within the HEDDA.IO user interface, is available here.
Data Links
Data Links play a crucial role in HEDDA.IO. These are operations that involve retrieving relevant data from a reference data source based on shared identifiers to also supplement information in a dataset.
Use Case
Consider a scenario where you have a dataset featuring a list of products associated with various customers, and your focus
is solely on the client and product_name columns. Imagine that one of these customers, referred to as CustomerX, decides
to alter the names of all their products. Consequently, you find yourself in the need to update your dataset with the revised product names.
To achieve this, you initiate a Data Link pointing to a table containing the client, old product names, and new product names
(let’s denote these as client, old_product_name, and new_product_name). Subsequently, you formulate a Business Rule with a condition that verifies the client’s name you intend to modify—in our case, it’s Client is equal to CustomerX. Additionally, you introduce a second condition or sub-condition to match the product_name in the source dataset with the old_product_name in the Data Link table.
Next, you establish an Action designed to substitute the value in the product_name column with the corresponding value from the new_product_name column in the Data Link table.
Consequently, whenever HEDDA.IO encounters a row with the value CustomerX in the client column and successfully aligns the product_name in the source dataset with the old_product_name in the Data Link table, it systematically replaces that value in the product_name column within the source dataset with the value derived from the new_product_name column in the Data Link table.
A guide on where to find, and how to add Data Links within the HEDDA.IO user interface, is available here.
Runs
Within the HEDDA.IO application, a Run is simply a container in which Executions and their respective Statistics are stored. Runs add context to executions so that you can then easily locate the statistics linked to respective executions, whenever you need.
Use Case
Suppose you are initiating HEDDA.IO executions from Databricks and Synapse Analytics pipelines, as well as from Polyglot Notebooks, each utilizing distinct datasets. In such a scenario, if all these executions share the same Run, it can lead to a entanglement of execution statistics, making it challenging to discern and locate specific metrics within the multitude of executions.
To address this, it is advisable to create a separate Run for each pipeline triggering a HEDDA.IO execution. This approach ensures that execution statistics for each pipeline remain organized and easily accessible, facilitating a more efficient analysis of the performance and outcomes specific to each dataset and pipeline.
A guide on where to find and how to add Runs within the HEDDA.IO user interface, is available here.
Preview
The Preview feature has been designed to provide you with the capability to Preview a sample or a full set of your data and see how it performs in the context of the Knowledge Base that it is executed from.
HEDDA.IO makes this possible without ever needing to leave the Frontend.
This functionality involves the execution of HEDDA.IO against a Data Link table pointing at the dataset you want previewed, using a Mapping attached to a Run where the execution statistics will be saved. The results are then presented in a table format, with a toolbar that enables you to query the processed data by applying various filters.
You can also access statistical information for the processed dataset with a click of a button.
Use Case
Imagine you have an extensive dataset that you intend to process through HEDDA.IO, and you’re faced with the task of configuring dozens or even hundreds of dataset and/or Business Rules. Periodically, you find it necessary to Preview the data processed against the configured Business Rules to check the performance of HEDDA.IO and to ensure accuracy and alignment with your expectations.
In such scenarios, a practical approach involves setting up a Data Link table that references a sample of your source dataset. Additionally, you can create a dedicated Run specifically for this purpose. By utilizing this setup, you can seamlessly review the performance of executing the data against the Knowledge Base, ensure that your Knowledge Base configurations is error-free and that the processed data aligns with your anticipated outcomes.
A guide on where to find and how to navigate the Preview menu within the HEDDA.IO user interface, is available here.
Runner Data Upload
This functionality extends beyond the HEDDA.IO Frontend; within the HEDDA.IO Runner, you can also enable Data Upload.
Mappings
In HEDDA.IO, Mapping is an operation that associates Domains with columns from a dataset. It ensures that the data within different Domains and columns are correctly aligned, enhancing the overall consistency and accuracy of the dataset.
A guide on where to find and how to add Mappings within the HEDDA.IO user interface, is available here.
Knowledge Base Versioning
In HEDDA.IO, the initial step to utilize a Knowledge Base involves publishing it. This functionality serves a dual purpose, allowing the establishment of a version history as well as the ability to have the Knowledge Base reviewed before it being published. The primary page of the Knowledge Base is perpetually set in Read Only mode. This signifies that you can exclusively view or read values, without the capability to alter, delete or add entities.
To achieve any of the three actions, you must switch to the Edit Version mode, accessible by selecting Edit Version located at the upper-right corner.
Details on how to add, modify, or remove entities are outlined in the relevant documentation corresponding to each section within the Project Navigation Bar.
More information on the Edit Mode is available here
User Interface
Homepage
The initial point of interaction with the HEDDA.IO application is the Homepage. Here you can either initiate the creation of a new Project or access existing ones.
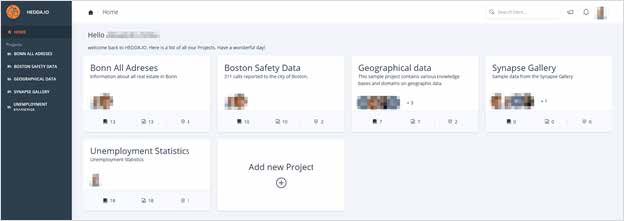
Image 2: Homepage
On the left-hand side, the Browsing Panel is clearly visible. Positioned at the upper part is the Header, and on the bottom side is the Footer. All three components are conveniently accessible from any location within the application.
Browsing Panel
Situated in the upper part of the Browsing Panel, just beneath the Logo, is the Home button. A simple click on this button will bring you back to the Homepage.
Directly under the Home button lies the list of already created Projects. Selecting a Project from the list will result in its expansion, revealing the dashboard button and a list of associated Knowledge Bases specific to the chosen Project.
Furthermore, clicking on a Project will also lead you to the Project Dashboard, a point we will revisit shortly. The Project Dashboard can also be accessed by selecting the corresponding Project card located in the Projects Overview of the Home page.
Image 3: Help Button
At the bottom of the side menu bar, you will find the HELP button.
Clicking this button will navigate you to the help page, where you can find a full documentation of HEDDA.IO.
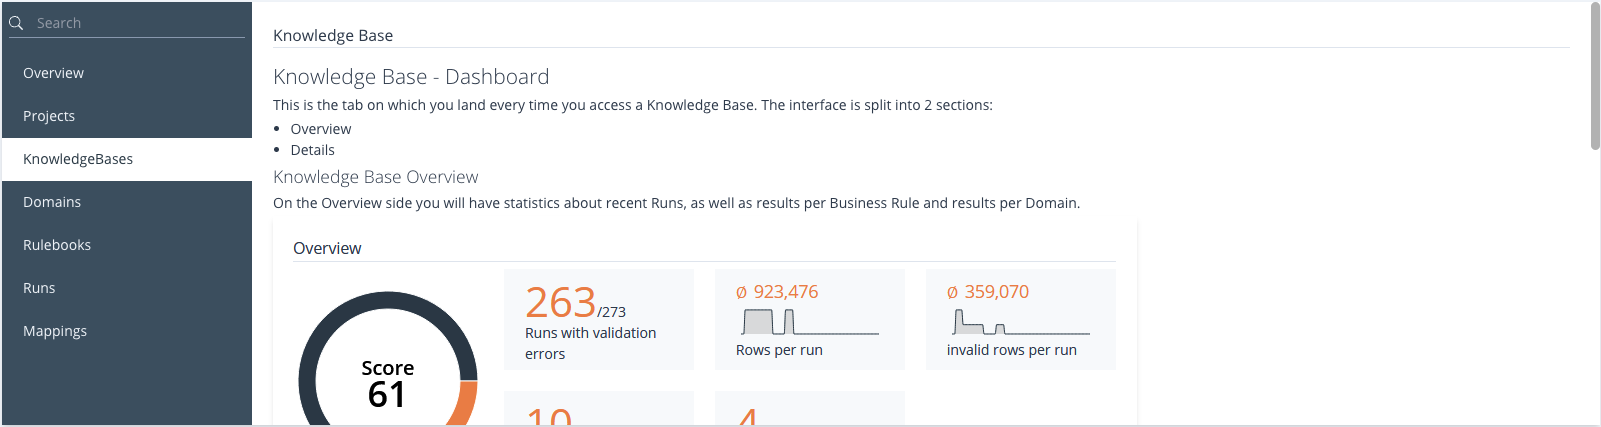
Image 4: Help Documentation
Header
Towards the left side of the Header, you will find the navigational breadcrumbs, that will take you back to a particular page in the navigational path, including the Home page.

Image 5: Header
Situated on the right side of the Header, you will find a search bar designed to aid you in locating any object within HEDDA.IO, provided you possess the appropriate access. Adjacent to it, the Announcements and Notifications buttons can be found; upon clicking, these will reveal the history of Announcements and Notifications.
At the far right of the Header, you have the option to click on the user’s profile picture, thereby opening the user profile menu. This menu facilitates actions such as switching the application’s language and managing API Keys.
API Keys Manager
Accessing the API Keys Manager involves selecting the API Keys button located within the user profile menu. This action opens a panel that allows the user to see existing API Keys and generate fresh ones.
Previously created API Keys are not displayed fully.
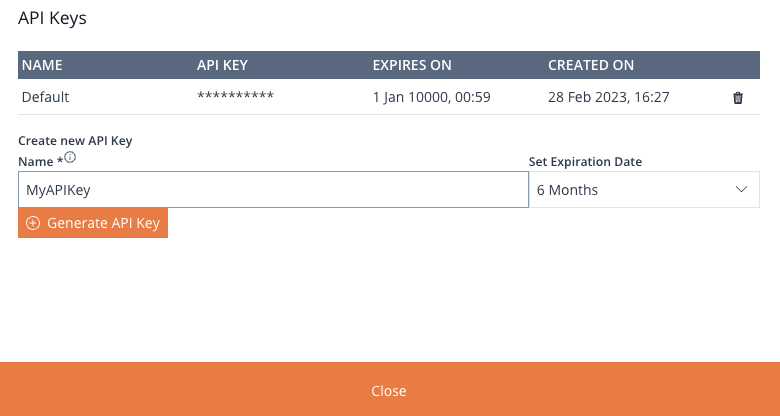
Image 6: API Keys Management Panel
Positioned at the upper section of the panel, you will encounter a table containing all generated API Keys. This table is divided into four columns: NAME, API KEY, EXPIRES ON, and CREATED ON. Situated at the far right of each API Key is a delete button.
Create New API Key
The subsequent section within the API Keys Management panel facilitates the generation of a fresh API Key. Simply enter a name in the designated field and specify the desired expiration date for the API Key. Conclude the process by clicking the Generate API Key button.
Upon completion, click the Close button located at the bottom , or the `X“ icon button in the top-left corner of the panel.
Language Selection
The language selection is available under the user profile button, which you can always find in the utmost top-right corner of the application.
Currently, HEDDA.IO supports two languages: English and German.
Footer
On the bottom side of HEDDA.IO, we have the footer, which contains three important pieces of information. The logo of the developer, the copyright marker, and the current version of HEDDA.IO.
Project Overview
In the middle of the Homepage, the Add New Project button is positioned prominently.
Once you have already created Projects, each Project will be presented in distinct cards containing the Project Name, Description, and the Users with granted access. Additionally, these cards provide essential metadata, including the count of Knowledge Bases
![]() , Domains
, Domains ![]() , and Business Rules
, and Business Rules![]() housed within each Project.
housed within each Project.
Add New Project
Clicking the Add New Project button will open up the Add Project panel.
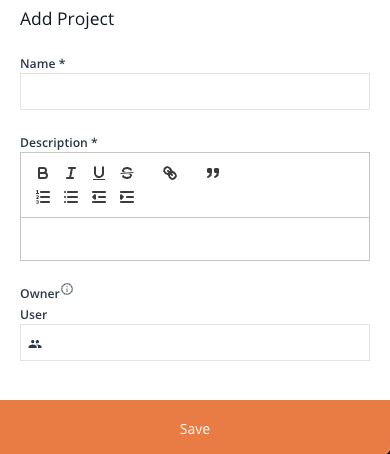
Image 7: Create New Project Panel
The panel allows you to set a Name, a Description for the Project, as well as select the Owner of the Project.
Once done, you can click the Save button at the bottom of the panel to save and create the Project. The Project can now be accessed from the side bar menu or from the Project Overview.
Project
Upon accessing a Project, the first elment we see is the Project Name. Directly underneath resides the Project Navigation Bar. Projects are essentially workspaces within HEDDA.IO, designed to cater to your distinct needs for utilizing the HEDDA.IO platform. This includes, Project-wide, necessary External Connections and Events as well as user management.
Upon accessing a Project, the first element we see is the Project Name. Directly underneath resides the Project Navigation Bar.
Project Navigation Bar
The Navigation Bar comprises four tabs:
- Dashboard
- External Connections
- Events
- Alert Log
The canvas situated below the navigation bar adapts its content according to tabs selected on the bar.
Project Dashboard
Upon selecting a Project, the user is directed to the Project Dashboard as their initial landing point.
The Project Dashboard is divided into two distinct sections: the left-middle panel, which is the Dashboard Panel, it encompasses the Statistics and the Knowledge Base Overview, and the Project Info Panel located on the right-hand side, which encompasses the details, Project Owner, and the list of Users which access to the Project.
Dashboard Statistics
Positioned at the upper side of the Dashboard Panel is the Project statistics section.
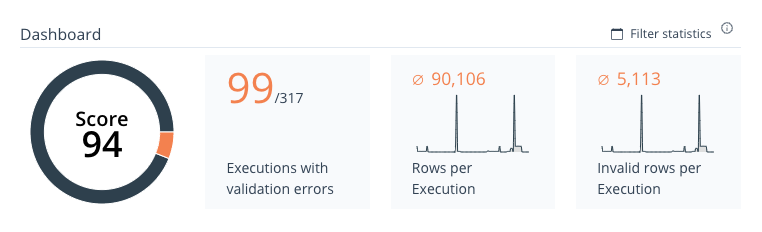
Image 8: Dashboard Statistic Panel
This section contains statistics that include:
- The overall score ranging from 0 to 100.
- Count of Executions with validation errors.
- Count of rows per Execution.
- Count of invalid rows per Execution.
At the upper-right corner is a statistics filter that allows you to refine your statistical queries by specifying a date range.
By clicking the Filter statistics button, you can access the Filter statistics by Date Range panel.
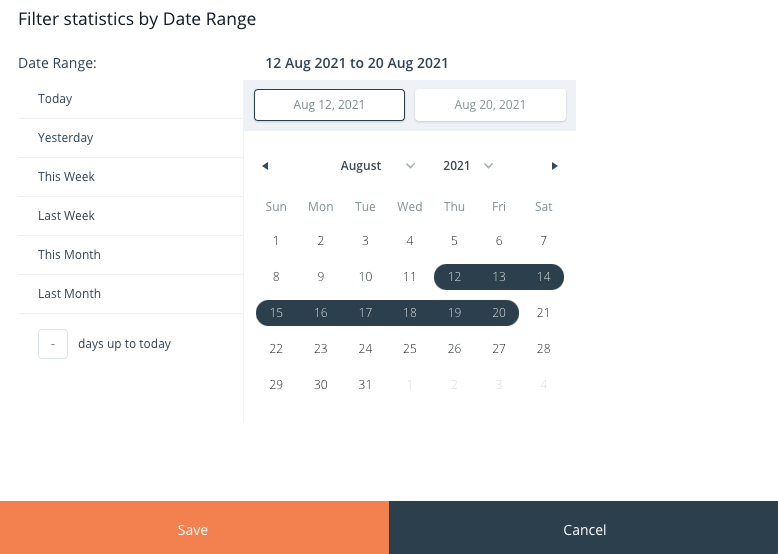
Image 9: Dashboard Statistics Filter Panel
Within this panel, on the left-hand side, you have the option to choose from a range of predefined date periods, including:
- Today
- Yesterday
- This Week
- Last Week
- This Month
- Last Month
Directly below, you can specify a certain number of days leading up to the current date. Alternatively, you also have the flexibility to define a custom date range using the date picker tool located on the right side.
Knowledge Bases Overview
Within the corresponding Project, this section showcases the roster of Knowledge Bases. It is located right below the Statistics section.
You have the capability to vertically navigate through the list, opt for the specific Knowledge Base you wish to access, or create a
new Knowledge Base, by clicking the Add Knowledge Base button located in the top-right corner of the section.
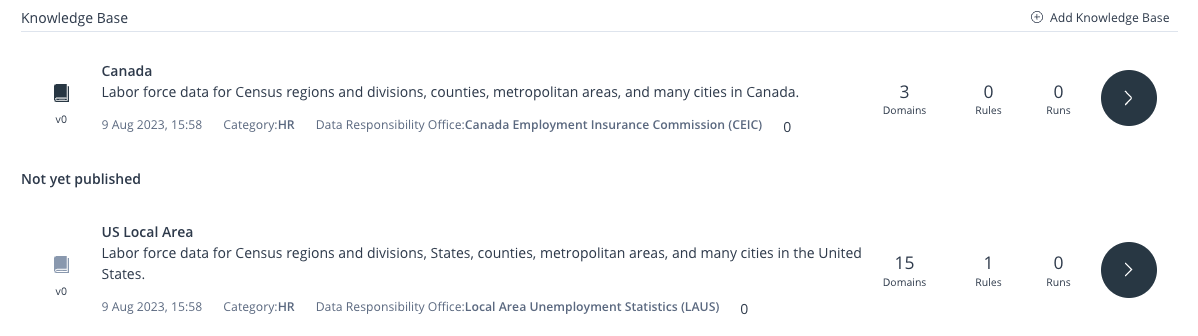
Image 10: Knowledge Bases Overview
Each entry in the Knowledge Base list includes the following details:
- Latest published Knowledge Base version
- Name
- Description
- Last edit date and time
- Category
- Data Responsibility Office
- Domain count
- Business Rules count
- Runs count
By engaging the Arrow icon positioned on the right-hand side of a given Knowledge Base entry, you can navigate to the respective Knowledge Base page. The buttons to the left of the Arrow, tagged as Domains, Rules, and Runs, will also navigate you to the respective Domains, Rules, and Runs, when clicked.
Furthermore, in case you have unpublished Knowledge Bases, they will be displayed accordingly in this section, under Not Yet Published.
For an in-depth look at the Knowledge Bases, click here.
Project Info Panel
On the right-hand side of the Project’s dashboard, you will encounter the Project Info Panel. In the upper right corner of this panel, an Edit button is positioned, granting you the capability to revise the Project’s name, description, and Owner, or delete the Project.
In the Details section, you will see the description of the Project.
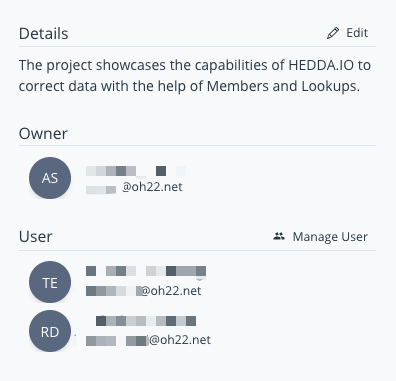
Image 11: Project Info Panel
Under the Details section, the Project Owner’s name is displayed, followed by a roster of users with varying degrees of access to the Project. Adjacent to this, is a Manage User button, designed to facilitate the administration of user permissions.
Edit/Delete Project
Locate and click the Edit button in the top-right corner of the Project Info Panel. This will open the Edit Project panel, allowing you to change the name, the description and the Owner of the Project.
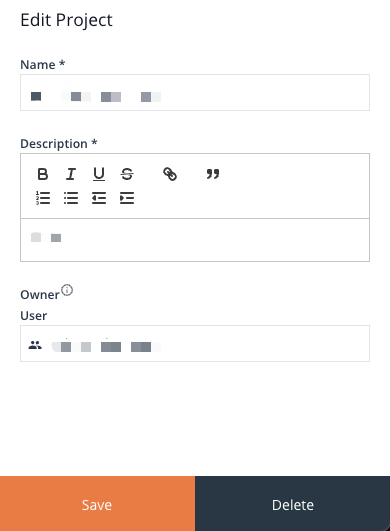
Image 12: Project Edit Panel
To Delete the Project, locate the Delete button in the bottom-right corner of the panel.
Manage Users
Upon clicking the Manage Users button, the User Permissions panel will open, allowing you to adjust the access level for users who were already given permissions, as well as give permissions to new users.
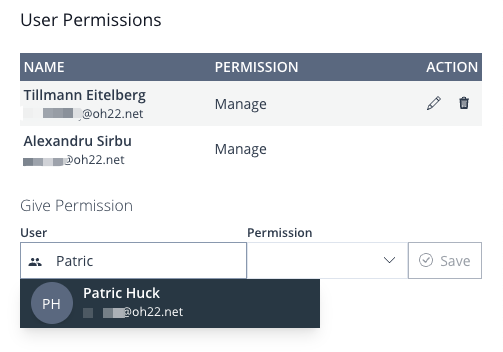
Image 13: Manage Users Panel
In the upper section, you can find a list of all the users that were already given permissions. Below that, you have the Give Permissions section, which allows you to select Members and Permissions you want to grant them.
You can simply start typing the name of the user and a dropdown will present you with suggestions. The suggestions are fed from the Azure Active Directory Tenant associated with the environment to which HEDDA.IO has been deployed.
Add/Edit/Delete User Permissions
To the right of each user, you can see the Edit and the Delete buttons. Clicking the Edit button will allow you to edit the permissions for the selected user. Click Save to save changes. Clicking the Delete button will remove all permission from the user.
External Connections
The External Connections page can be accessed by clicking the External Connections tab in the Project navigation bar.
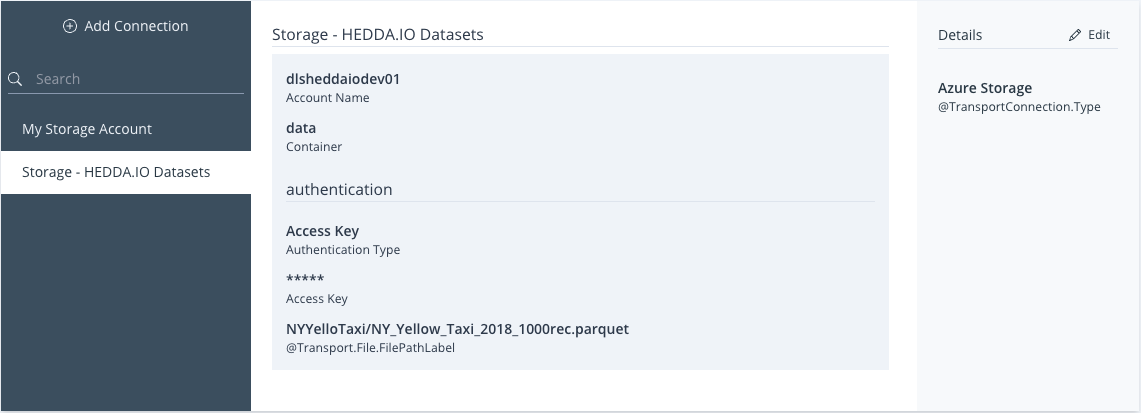
Image 14: External Connections Dashboard
The page is split into three distinct panels:
- Connections Browsing Panel
- Connection Overview
- Connection Info Panel
Connections Browsing Panel
The Browsing Panel is located on the left side of the External Connections page. It hosts the Add Connection button on the very top, then a list of External Connections with a search option on top, which will help you find the External Connections faster, by filtering the list of Connections, based on whether there are any items in the list that contain the sequence of characters you enter in the search.
Add Connection
Locate and click the Add Connection button located at the top of the Browsing Panel. This will open the Add Connection panel containing a form that will allow you to establish a connection with one of the three currently supported providers:
- Azure Storage
- Microsoft SQL Server
- Reference Data Service
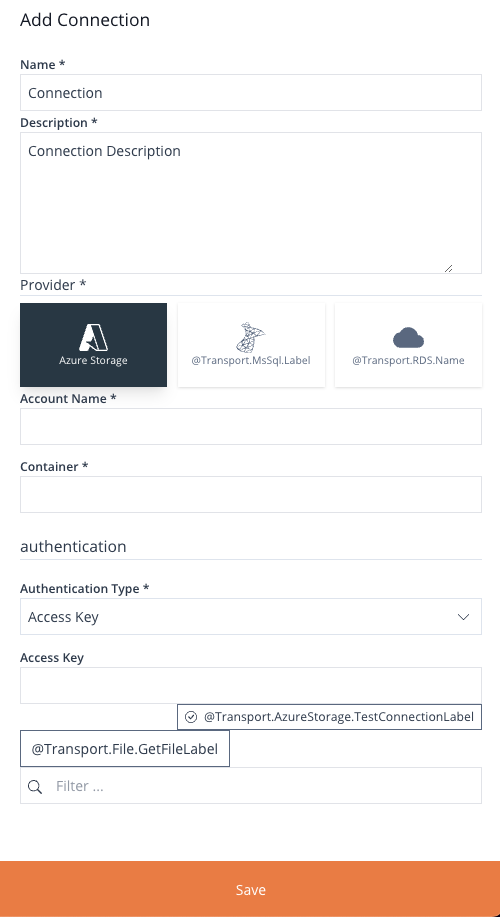
Image 15: Add Connection Form
Connection Configuration
In the central section, you can locate the configuration settings for the selected connection.
Connection Info Panel
On the right-hand side, you will find the Details section, showcasing the connection type.
Edit/Delete Connection
In the top-right corner of the Info Panel, you will notice the Edit button. This button permits you to make edits to connections or delete them.
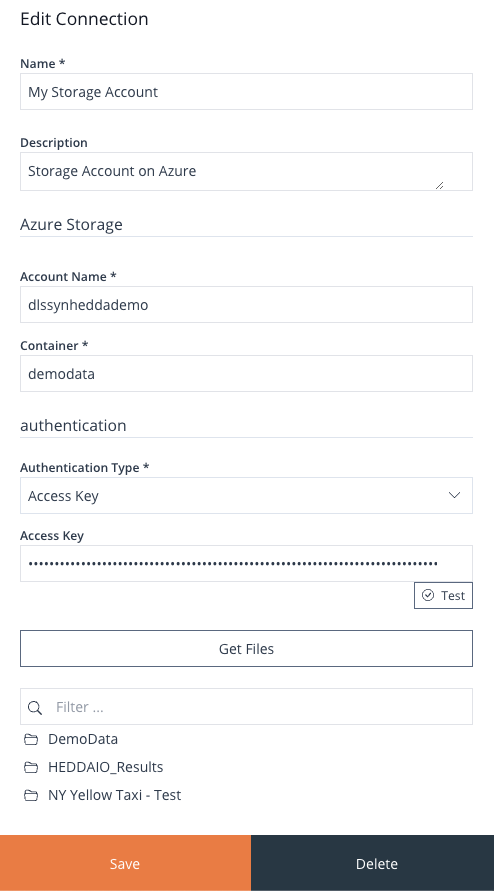
Image 16: Edit Connection Form
Here’s an example of what the Azure Storage connection form looks like. Within this form, you will encounter a Testing button designed to assess the connection. Once the configuration is accurate, clicking the Get Files button should unveil all the contents within the designated container. This will enable you to navigate through directories and opt for the specific file you intend to choose.
Click Save or Delete to save or delete the connection.
Events
Using Events in HEDDA.IO, you can for example send a Notification via Teams or Email when a new Execution has finished. You can also create work item in DevOps when a Dataset Rule has failed.
To access the Events page, navigate to the Events tab located in the top Project Navigation Bar.
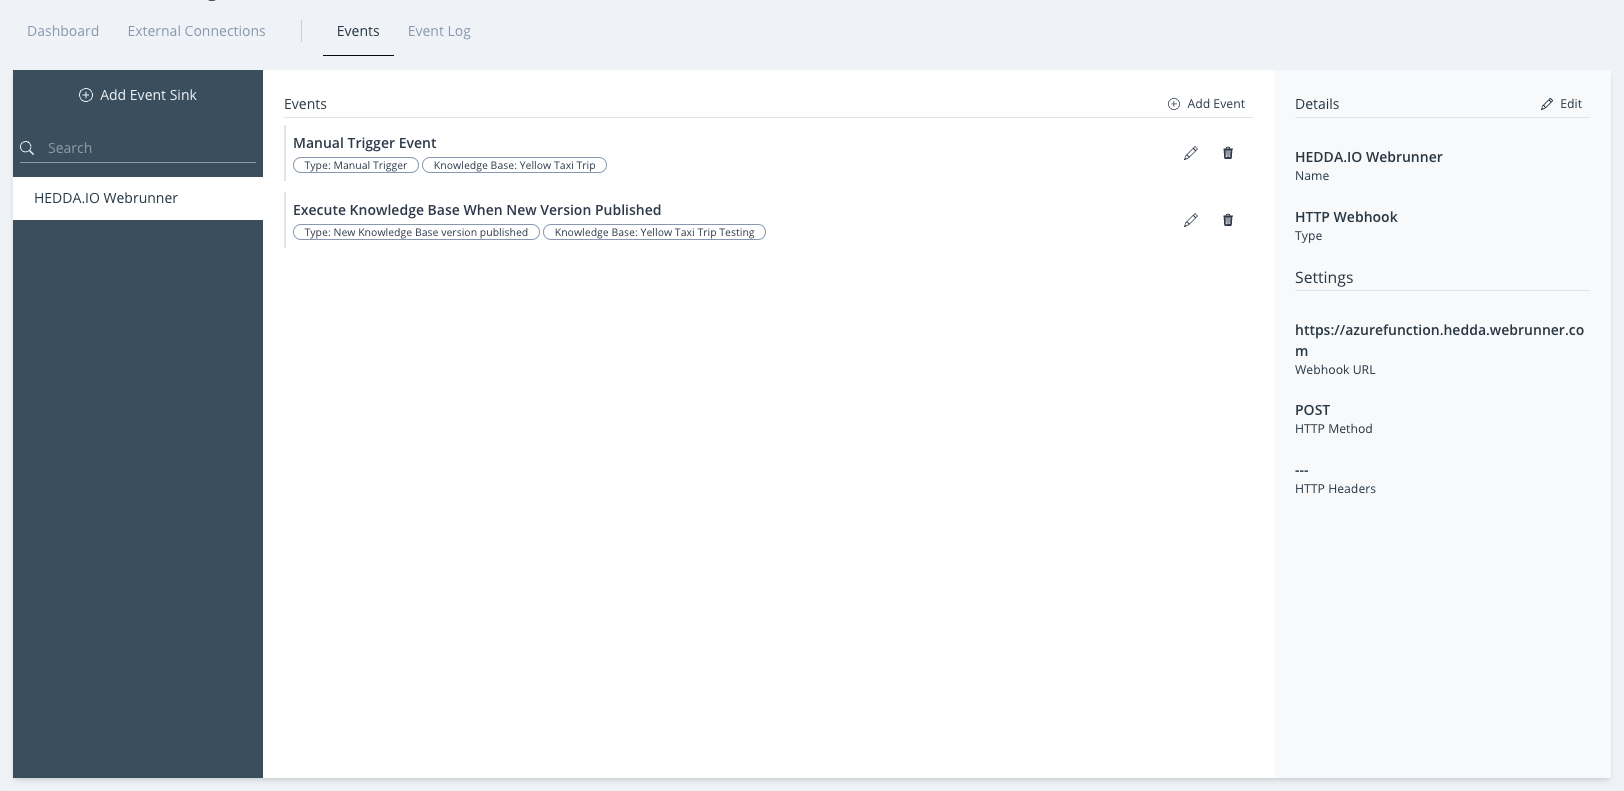
Image 17: Events Dashboard
The page is split into three panels:
- Event Sinks Browsing Panel
- Events Overview
- Event Sink Info Panel
Event Sink Browsing Panel
This panel is located on the left side of the page.
At the top, you can see the Add Event Sink button. Just below that, there is a search input field designed to assist you in locating sinks, which are listed right below the search bar.
Add Event Sink
Before creating an Events, we must first create an Event Sink. In simpler terms, this entails forming a link to the service that should respond to our Events.
HEDDA.IO currently supports the following Event Sink types:
- Azure Event Hub
- Azure DevOps
- SMTP Email
- Azure Event Grid
- Slack
- Teams
- Webex
- HTTP Webhook
In order to add an Event Sink, locate and click the Add Event Sink button. This will open the Add Event Sink panel that contains a form for configuring an Event Sink.
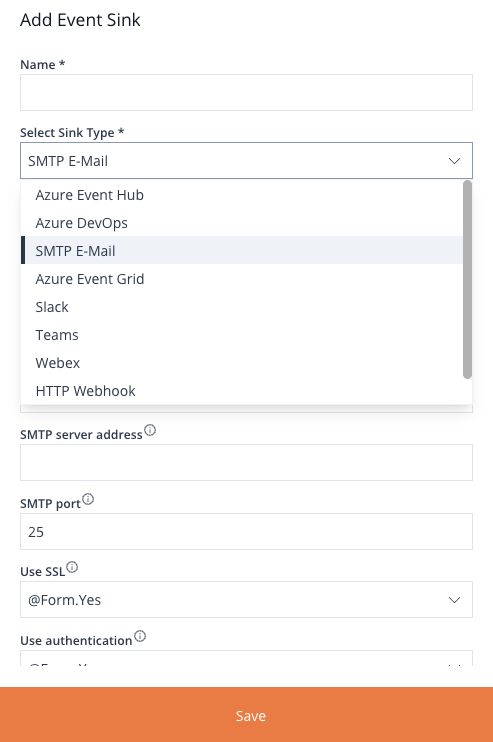
Image 18: Add Event Sink Form
The form is comprised of two primary fields, Name and Sink Type, as well as a collection of inputs determined by the chosen Sink Type, as shown in the example above.
Click the Save button at the bottom of the form to save the Event Sink and close the panel.
Events Overview
The middle section of the page will list all created Events.
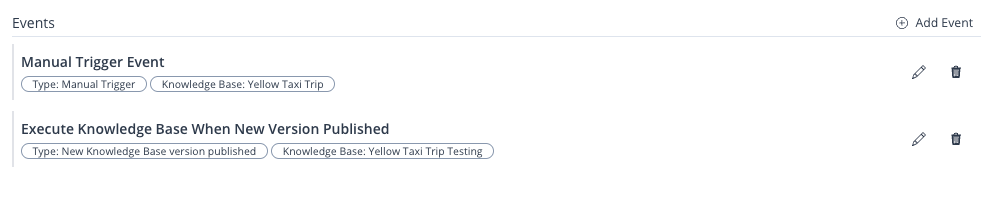
Image 19: Events Overview
Each item in the list is represented by the Name, as well as the inputs that were configured. On the far-right side, each item has an edit and a delete button.
Add/Edit/Delete Events
After setting up the Event Sink, you are ready to create an Events on top of it.
To initiate the Events creation process, you can locate the Events creation button situated at the upper-right corner of the overview, just slightly above the roster of Events.
Upon clicking this button, a panel will unfold, presenting a form designed for crafting an Events. This form encompasses the following input fields:
- Name
- Description
- Events Type
- An array of inputs corresponding to the chosen Events category.
- Template
The template stands as the core content of the message, which includes essential metadata from the Knowledge Base. This content will be passed to the sink as soon as the Events is triggered.
Every kind of Events comes with a pre-established template message content. Nevertheless, you have the liberty to personalise the message content by switching to Template Override. This action grants you the ability to modify the message using tokens. For your convenience, a guide Mapping out these tokens is supplied right beneath the Template input box.
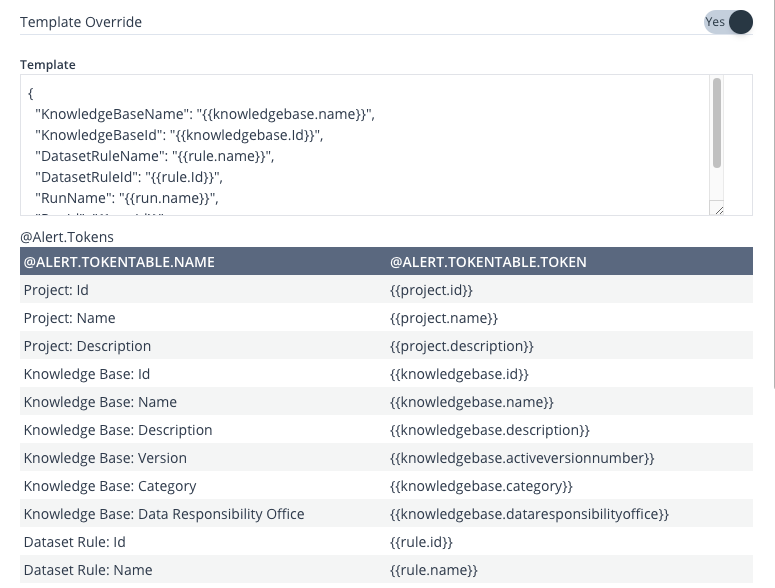
Image 20: Add/ Edit Event – Template Override
Based on Events Type, the available tokens might differ.
Click the Save button at the bottom of the form to save the Events.
Event Sink Info Panel
On the right side of the page, as always, is the Info Panel section, which includes metadata about the selected Event Sink, and an Edit button in the top-right corner to edit or delete the Event Sink.
Edit/Delete Event Sink
Clicking the Edit button in the top-right corner of the Info Panel, will open up the Edit Sink panel, allowing you to edit the pre-existing Sink, by adjusting the inputs and then clicking the Save button at the bottom of the form. Click the Delete button to the right, if you wish to delete the Sink.
Events Log
The Events Log page will display a record of all activities triggered within this Project’s Events.
This page is composed of a table located at the lower section and a filtering segment positioned at the upper section.
The table includes the subsequent columns:
- Events Type
- Sink
- Knowledge Base
- Run
- Timestamp
- Sent
Within the filtering segment, there are three buttons:
- Refresh: This button refreshes the rows within the table.
- Edit Log Filters: This button enables the filtering of rows within the table.
- Reset Filters: This button resets any applied filters.
By clicking the Edit Log Filters button, a panel will emerge, presenting a form that allows you to apply filters to the Events table in the log.
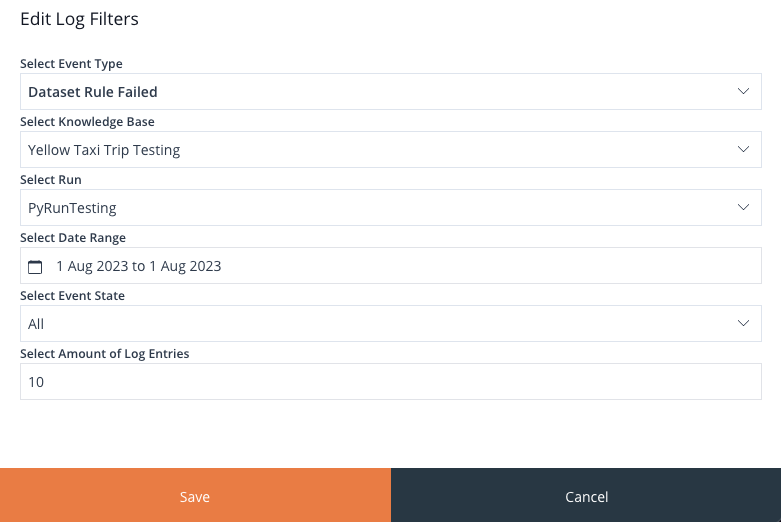
Image 21: Events Log Filter
Clicking Save will apply the filter to the table.
Knowledge Base
This part of documentation will get you familiar with the Knowledge Base page as well as guide you through the process of creating a Knowledge Base.
Add Knowledge Base
Selecting the Add Knowledge Base button positioned right above the Knowledge Bases Overview on the Project Dashboard will trigger the opening of the Add Knowledge Base panel.
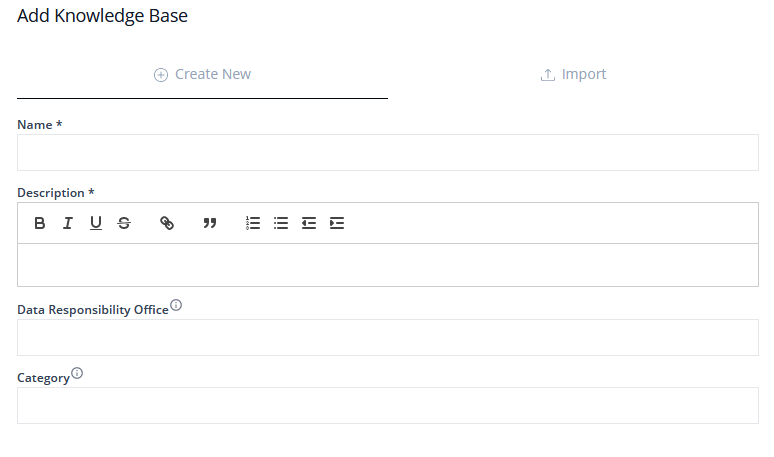
Image 22: Add Knowledge Base Form
This particular panel is divided into two tabs, each offering distinct methods for incorporating a Knowledge Base:
- Create New
- Import
Create New
In this section, you can create a Knowledge Base from scratch. The only mandatory field is the Name and the Description, while additional information, like Data Responsibility Office and Category, are optional. This flexibility allows you to add extra context and categorisation either as needed or at a later point.
Import
The import procedure unfolds in three distinct stages: Select Provider, Select Knowledge Bases, and Finalize. This comprehensive process empowers you to seamlessly import Knowledge Bases from a variety of three distinct sources:
- Local File
- Azure Storage
- Microsoft SQL Server
Local File
Load a Knowledge Base from a local .parquet, .XLSX, or a .heddaexport dataset file.
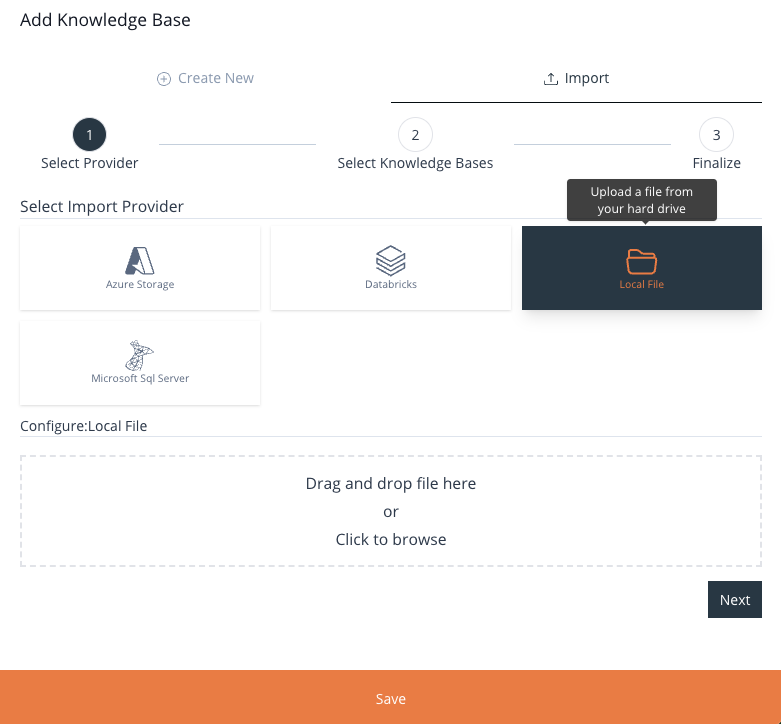
Image 23: Add Knowledge Base Form – Local File
After you’ve selected the file, proceed by clicking the Next button. The subsequent and concluding phase of this process, in addition to providing a name, description, Data Responsibility Office, and Category, also allows you to handpick the specific Domains you wish to include in your freshly imported Knowledge Base.
By default, all available Domains will be pre-selected for incorporation into the Knowledge Base. Should you wish to exclude any Domain, a simple click on the respective Domain will deactivate its selection, effectively excluding it from the import.
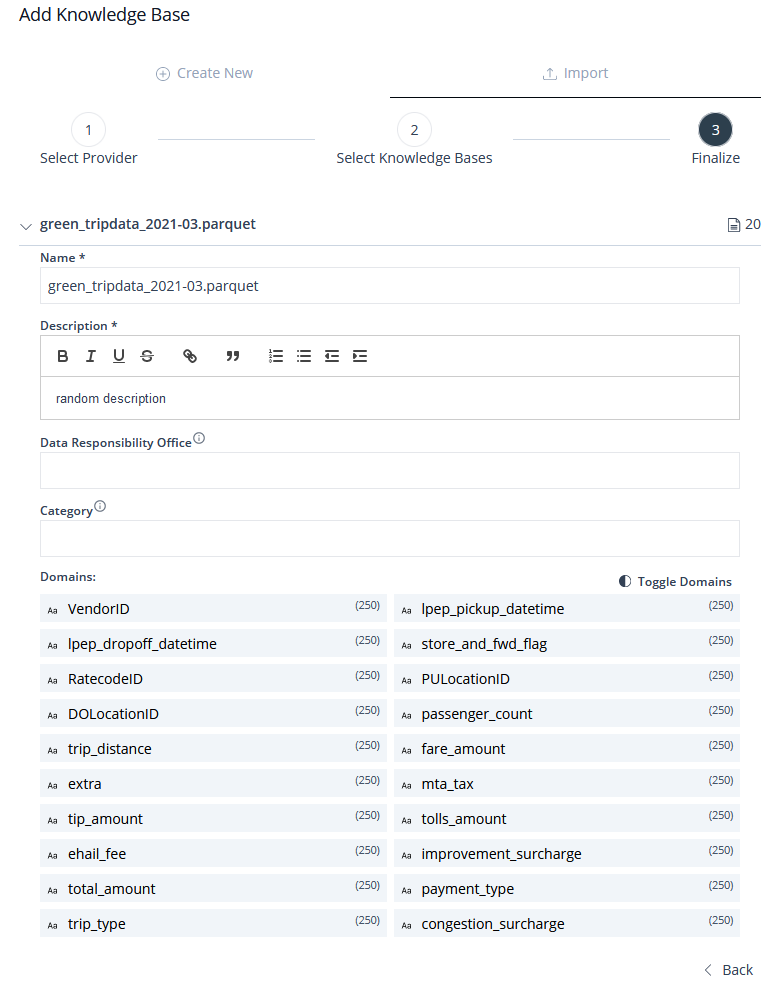
Image 24: Add Knowledge Base Form – Local File Form
The Toggle Domains toggle is to either mark previously unchecked items as checked or vice versa.
Should you desire to opt for an alternative file, a simple click on the Back button, positioned at the bottom of the form, will redirect you to the previous menu, enabling you to choose a different file for import.
Upon completing this step, proceed to click the Save button located at the bottom of the menu. This action will conclude the import procedure. Subsequently, your imported Knowledge Base will be visible within the list, bearing the designated name you provided.
Azure Storage
Load a Knowledge Base form a .parquet file stored in an Azure Storage Account.
For this specific method of import, you will need to provide the following information:
- An account name.
- An access key to the account (Optional – Only applies to access key authentication type).
- The name of the container the file is stored in.
- The path to the file within the specified container.
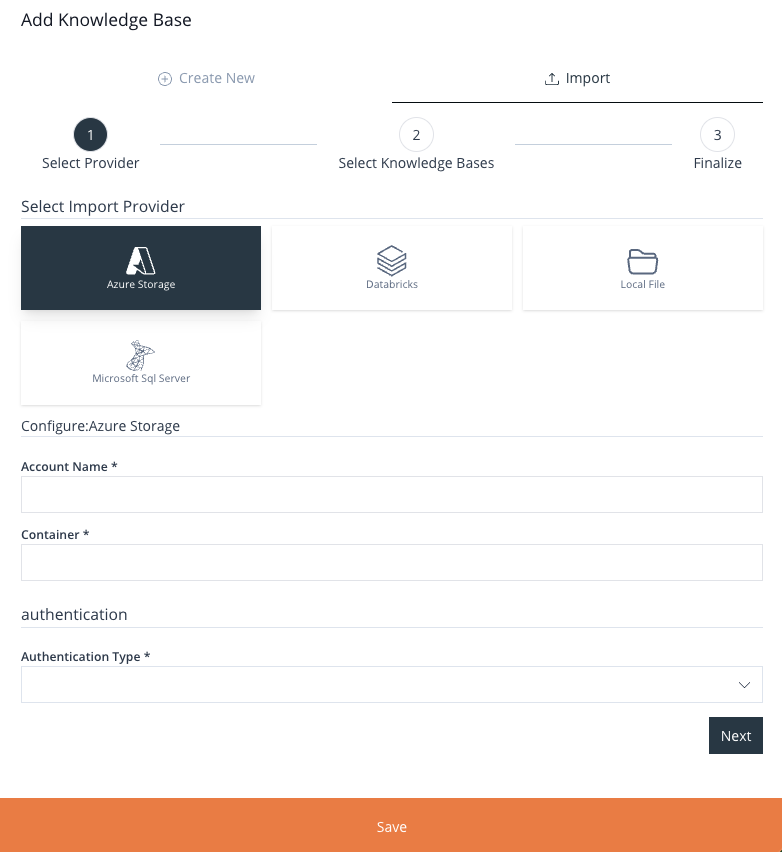
Image 25: Add Knowledge Base Form – Azure Storage Form
After finishing this step, move ahead and select the Save button positioned at the lower part of the menu. This activity will finalise the import process. Following that, the list will display your imported Knowledge Base with the name you assigned to it.
Microsoft SQL Server
Import a table or multiple tables from a SQL database as Knowledge Bases.
Depending on the type of authentication you choose, a different set of inputs will be shown.
There are three types of authentication methods available:
- Service Principal
- Connection String
- Credentials
Once we are connected to the SQL Server DB, we will be presented with available table/s to select. Note, you can select multiple tables, each will be imported as separate Knowledge Bases.
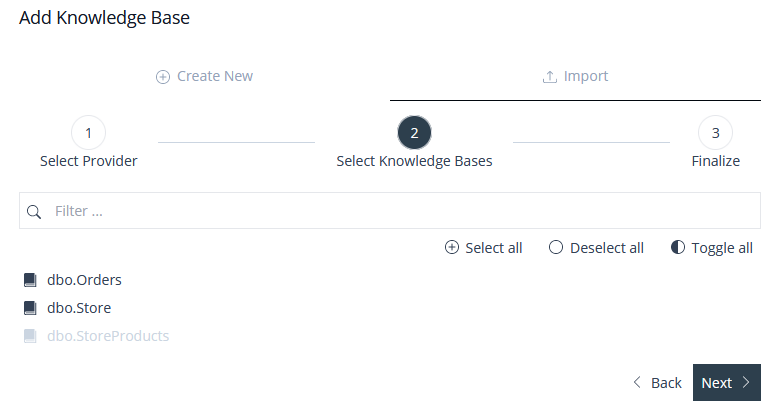
Image 26: Add Knowledge Base Form – Import MS SQL Server – Table Selection
Finally, edit the imported Knowledge Base/s before adding them to the Project.
After you finish this step, move on to selecting the Save button positioned at the lower part of the menu. This will mark the end of the import process. Following this, the list will display your imported Knowledge Base with the specified name you entered.
Knowledge Base Navigation Bar
Upon accessing a Knowledge Base, your initial focal point will be the Navigation Bar situated at the top. This bar provides access to various functionalities within the Knowledge Base.
This bar is equipped with 7 distinct tabs, each providing access to different segments of the Knowledge Base:
- Dashboard
- Domains
- Rulebooks
- Dataset Rules
- Lookups
- Runs
- Mappings
Positioned to the right of the Navigation Bar are two buttons: Export to File and Edit Version.

Image 27: Knowledge Base Navigation Bar
We’ll take a closer look at each of these tabs to see what’s inside them and what they offer. Later, we’ll also talk about how to export a Knowledge Base and how the Edit Version mode works.
Knowledge Base Export/Import
Exporting
Within HEDDA.IO, you have the capability to extract Knowledge Bases for the purpose of importing them into different Projects or even into HEDDA.IO instances in alternate environments.
This process is straightforward and involves clicking the Export to File button located at the upper-right corner of the Knowledge Base page. Upon clicking this button, the Export Knowledge Base panel will be unveiled, offering you the option to designate which components of the Knowledge Base you intend to export.
It makes sense to consider exporting the elements that pose the greatest setup complexity. This primarily encompasses the Domains, along with their corresponding Members, the Rulebooks, and the Dataset Rules.
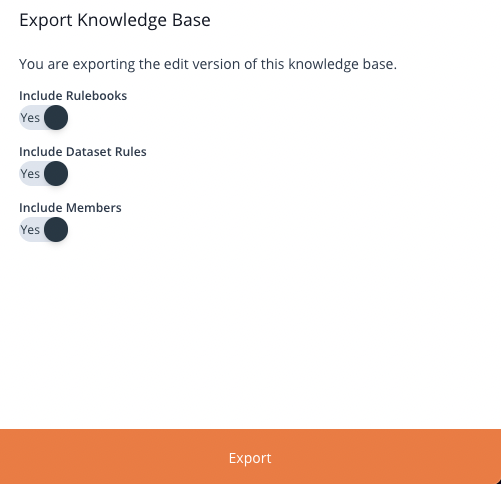
Image 28: Knowledge Base Exporting Panel
The Domains will be automatically included in the export. You are then provided with the choice to determine which among the remaining three components you wish to include in the export.
When you are prepared to proceed with exporting the Knowledge Base, simply click the Export button located at the base of the panel.
Importing
The import of the Knowledge Base export occurs upon the creation of the Knowledge Base. To initiate this process, you simply switch to the Import tab within the Add Knowledge Base panel and utilise the Local File button.
Read the Local File Import for more details.
Knowledge Base Edit Version
In HEDDA.IO, the initial step to utilize a Knowledge Base involves publishing it. This functionality serves a dual purpose, allowing the establishment of a version history as well. The primary page of the Knowledge Base is perpetually set in Read Only mode. This signifies that you can exclusively view or read values, without the capability to alter, erase existing entities, or introduce new ones.
To achieve any of the three actions, you must switch to the Edit Version mode, accessible by selecting Edit Version located at the upper-right corner.
Details on how to add, modify, or remove entities are outlined in the relevant documentation corresponding to each section within the Navigation Bar.
Knowledge Base Version Publishing
The Edit Version mode, as explained before, allows you to add, edit, and delete entities. However, these changes will not apply until they are published, which is done by pressing the Publish button when all the needed adjustments are complete.
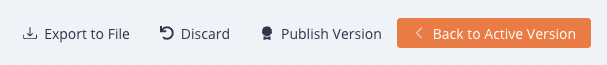
Image 29: Knowledge Base Version – Actions Panel
Once you click the Publish Version button, a small panel in the middle of the screen will display all the changes that will be applied to the Knowledge Base with the new version, allowing you to complete the publishing process or cancel it.
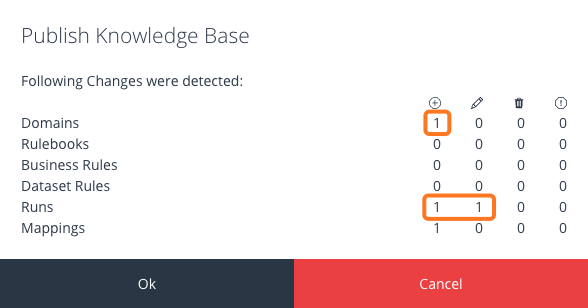
Image 30: Knowledge Base Version – Publish Review Panel
You can always go back to the active version by clicking Back to Active Version.
You also have the option to discard all changes in the Edit Mode by clicking the Discard button next to the Publish Version button.
Edit/Delete Knowledge Base
In order to edit or delete the Knowledge Base, you need switch to the Edit Version mode, which can be done by clicking the Edit Version button at the top-right corner of the page.
Once in the Edit Version mode, the Edit button is now present in the top-right corner of the Knowledge Base Info Panel.
Clicking the button will open the Edit Knowledge Base panel, allowing you to edit the Name, Description, Data Responsibility Office, and the Category.
Click the Save button to save the changes and close the panel.
Knowledge Base Dashboard
This is the page that you are directed to whenever you access a Knowledge Base.
The dashboard page is split into two sections:
- Knowledge Base Overview
- Knowledge Base Info Panel
Knowledge Base Overview
On the Overview side you will have statistics about recent Runs, as well as results per Business Rule, results per Domain and results per Dimension.
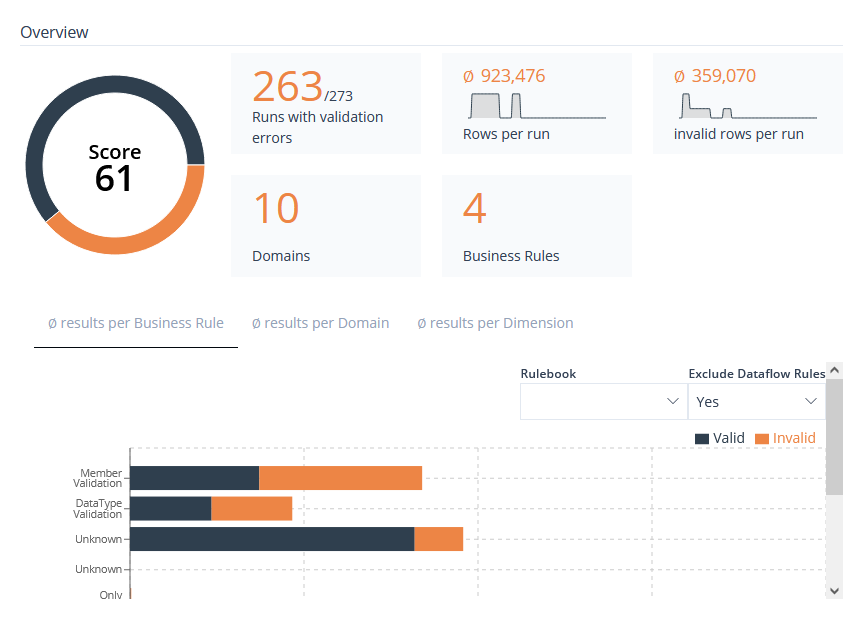
Image 31: Knowledge Base Overview
On the top-right side of the overview, we have a button called Filter Statistics.
By clicking this button, you can access the Filter statistics by Date Range and Version panel.
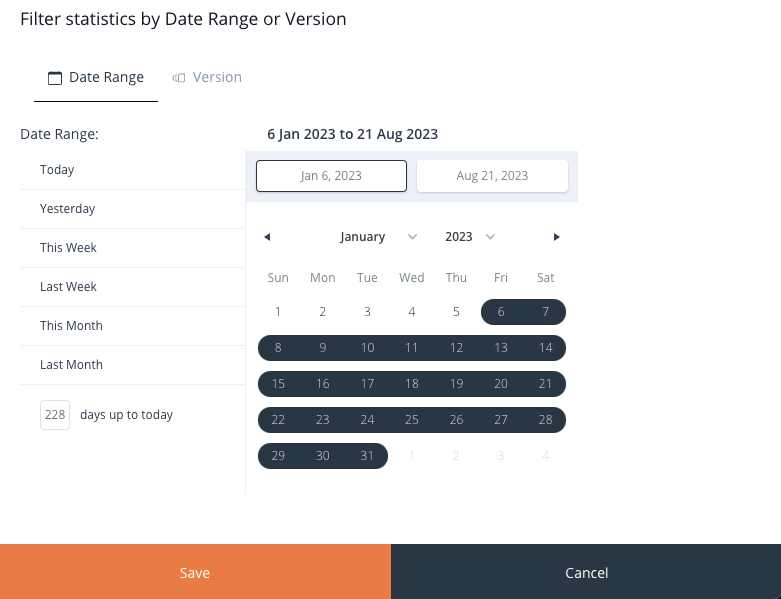
Image 32: Knowledge Base Filter Statistics Panel – by Date Range
Within this panel, on the top side, you can see two tabs:
- Date Range
- Version
When you click on the Date Range tab, on the left-hand side, you have the option to choose from a range of predefined date periods, including:
- Today
- Yesterday
- This Week
- Last Week
- This Month
- Last Month
Directly beneath, you can specify a certain number of days leading up to the current date.
Alternatively, you also have the flexibility to define a custom date range using the date picker tool located on the right side.
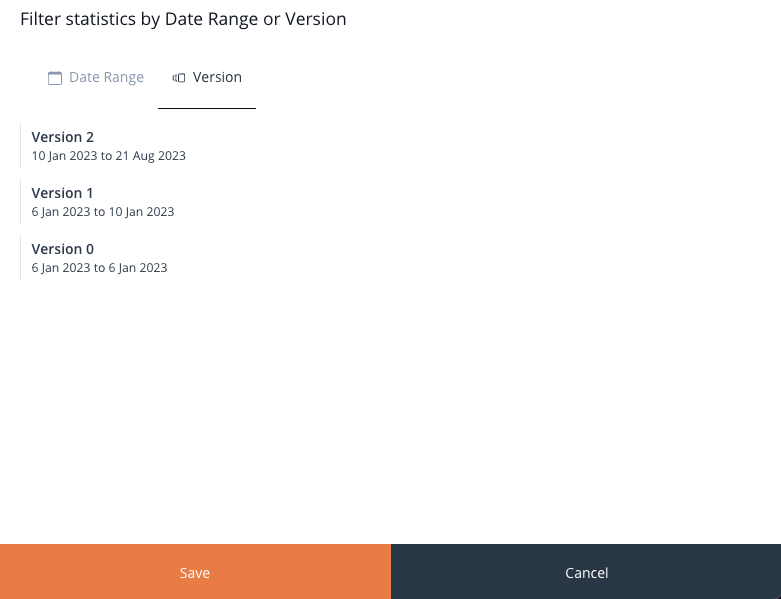
Image 33: Knowledge Base Filter Statistics Panel – by Version
Switching to the Version tab, you have a list of previously published Knowledge Base versions. This will allow you to filter the overview based on all previously published Knowledge Bases and their respective active times.
Knowledge Base Info Panel
As per usual, the Info Panel is located on the right side of the page. It
includes:
- Preview button
- The Description of the Knowledge Base
- The Data Responsibility Office
- The Category
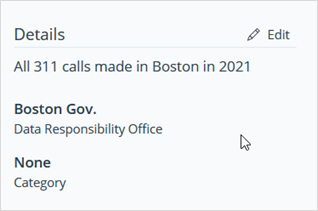
Image 34: Knowledge Base Info Panel
Preview
The Knowledge Base Dashboard provides access to the Preview button.
In the top-right corner of the Info Panel on the right, you’ll locate the Preview button.
Start Preview
Upon clicking the button, a window will appear, prompting you to select a Run and a Lookup. After selecting these, click OK to initiate the Preview.
This action triggers a HEDDA.IO execution on the chosen Lookup, followed by the opening of the Preview menu. Here, you can examine the data processed by HEDDA.IO.
View Data
Within the Preview menu, you have the ability to navigate and filter the dataset using various useful filters. Additionally, you can view the statistics associated with the execution.
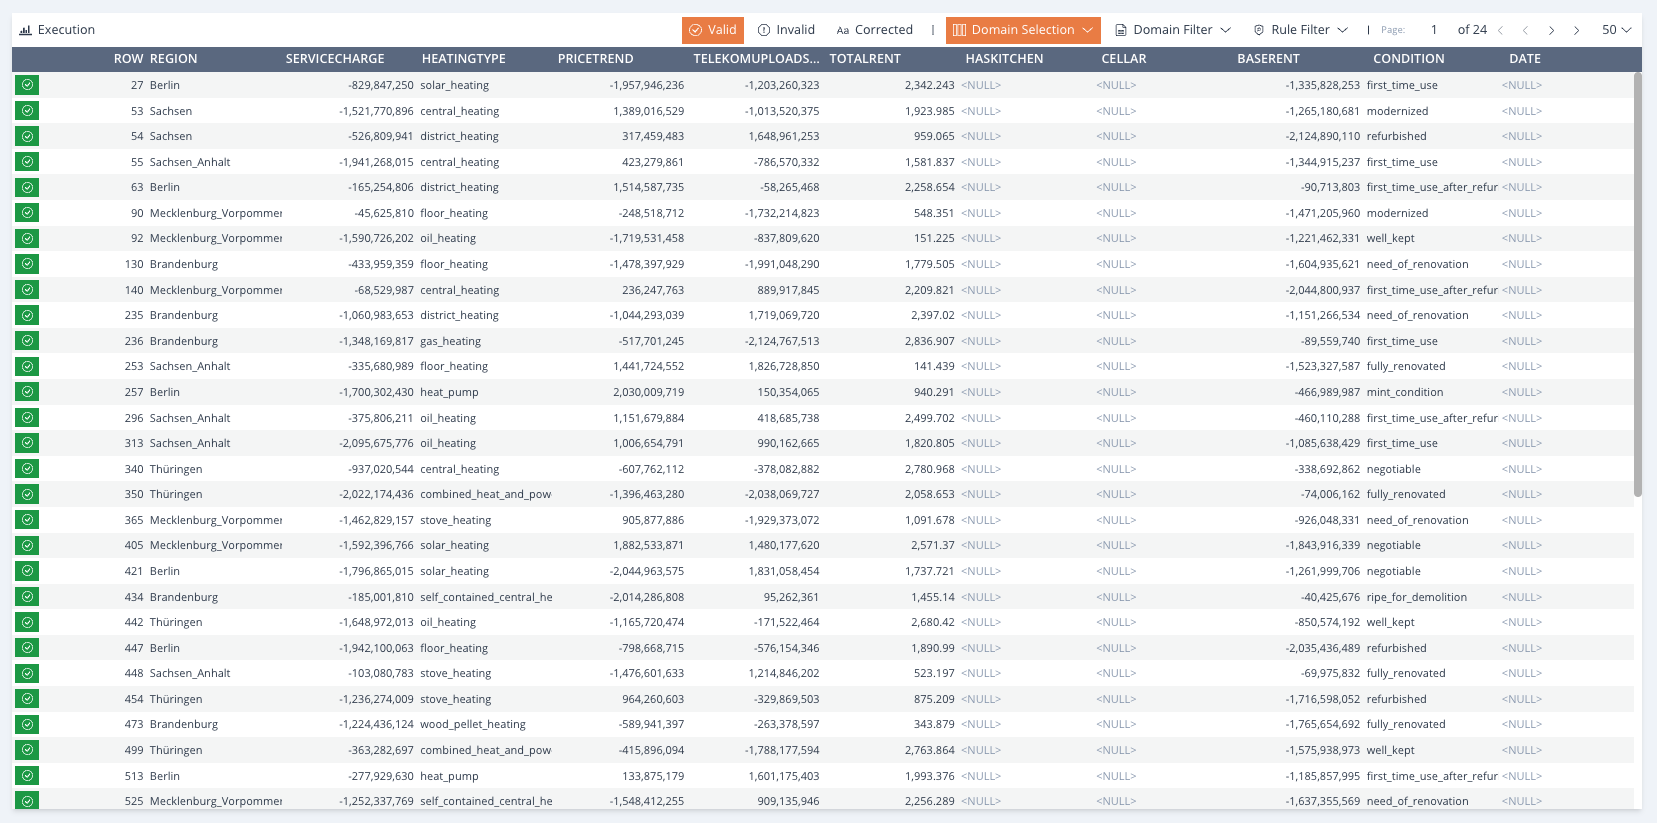
Image 35: Preview Panel
The toolbar situated just above the data table contains a series of buttons, each serving a distinct purpose. Let’s outline these from left to right.
-
Execution– Will unveil the statistics panel, showcasing the statistical information linked to the execution carried out for Valid– will display only the valid data rows.Invalid– will display only the Invalid data rows.Corrected– will display only the corrected data rows.-
Domain Selection– Will reveal a compact menu, enabling you to choose the Domains you wish to have presented in the Preview data table. Click on a Domain entry to either select or deselect it, then pressApply.Alternatively, utilise theAllbuttonto choose all the Domains, or theTogglebutton to select the currently unselected Domains or vice versa. Eg. Show onlyDomain AandDomain B. Domain Filter– Will open a compact menu that enables you to filter the Preview data table based on Domain value. Within this window, you can choose a Domain from the list and enter a corresponding value. ClickApplyonce you are content with your selection. Eg. Show Rows whereDomain AequalsValue.Rule Filter– Will open a compact menu enabling you to filter the Preview data table based on Rulebook and/or Business Rule state. You have the option to apply only the Rulebook filter by clicking theApply Rulebookbutton or apply only theBusiness Rulefilter by pressing theApply Business Rulebutton. Clicking theApplybutton will simultaneously apply both the Rulebook and Business Rule filters. Eg. Show Rows whereBusiness Rule Awas Invalid.-
Browsing Arrows– A set of arrows designed to assist you in navigating the Preview data table. The central arrows facilitatemovement between adjacent pages, while the outer arrows navigate to either the first or the last page of the Preview data table. Displayed Rows– The rightmost dropdown, located at the far end, permits you to select the number of data rows per page you desire to be displayed in the table below.
Every row within the Preview data table features either a green or red button on the far left side. Beyond signifying the validation status, clicking on it will reveal the results per row in a panel referred to as Row Result.
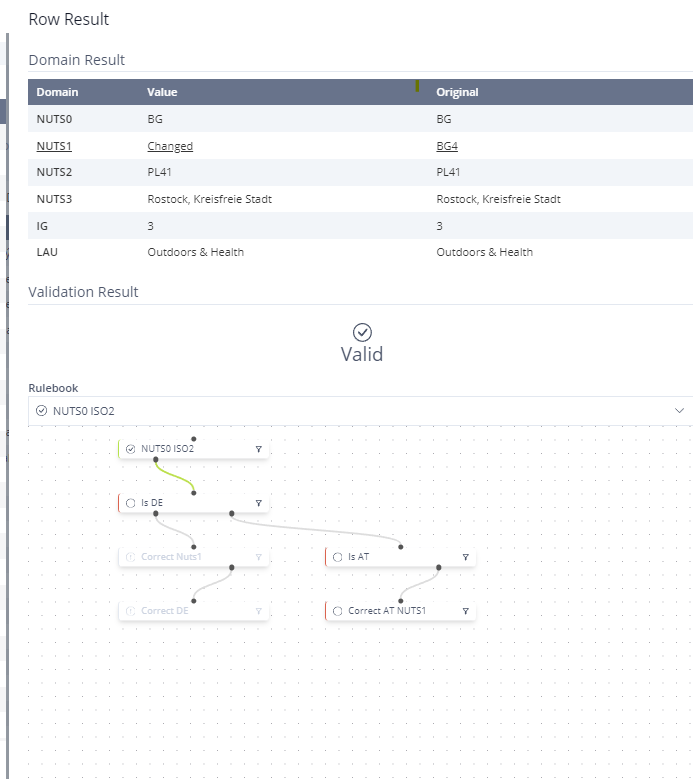
Image 36: Preview – View Data Per Row Panel
The panel comprises a Domain Results section, presenting each Domain in a list with two additional columns indicating the current value in that Domain and the original value.
The second section provides an overview of the overall validation status.
In the third section, you can navigate through each Rulebook against which the data rows have been checked. Here, you can view the business rules flow under the selected Rulebook on the canvas. Each Business Rule is accompanied by a filter button on the right side. Clicking on this button will filter the entire Preview data table based on the business rule and its validation status.
Runner Data Upload
Enabling Data Upload when executing HEDDA.IO Runner is accomplished differently based on the specific HEDDA.IO Runner you are utilising.
.NET Runner:
Hedda.Create(url, apiKey)

  .EnableDataUpload();
PySpark Runner:
Hedda.create(url, apiKey).enable_data_upload()
The data generated by this process can subsequently be examined. On the Run Screen, the presence of the Has Data flag alongside Executions signifies the availability of data for review.
When inspecting the Execution, you can click on Analyse Result set to examine the corresponding data. Similarly, you can review past Previews in a similar manner. On the Data View Page, Executions initiated directly by a Runner need to be registered; this can be accomplished by clicking on the Register button.
Domains
It is essential to create a Domain for each data column in your dataset, that you want to execute against HEDDA.IO.
The Domains tab is split into 3 panels:
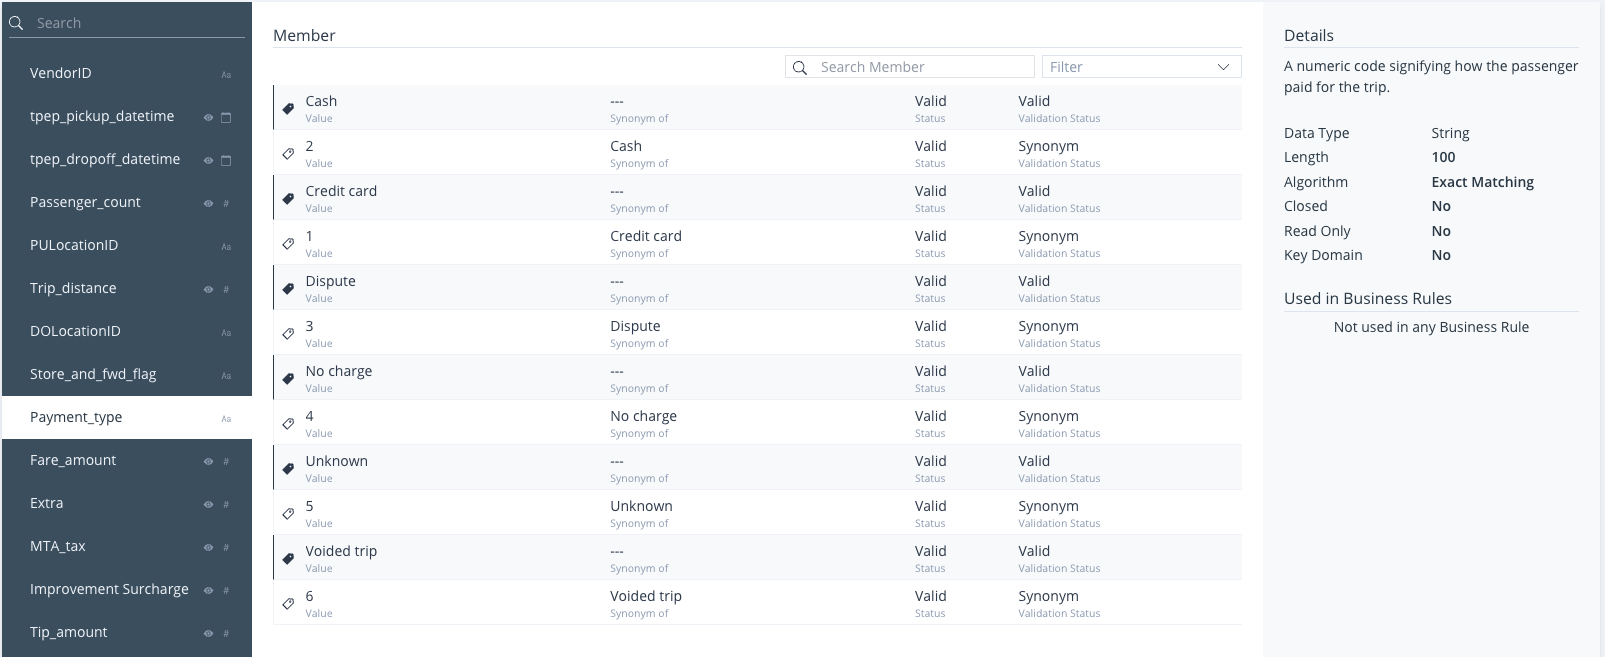
Image 37: Domains Dashboard
Let’s take a look at these sections more closely, starting from the Domains Browsing Panel on the left.
Domains Browsing Panel
Presented here is a compilation of already created Domains.
Adjacent to each Domain on the right-hand side, you’ll find small icons denoting the Domain’s data type, along with indicators for whether it is in a read-only state, closed, or falls into neither category.
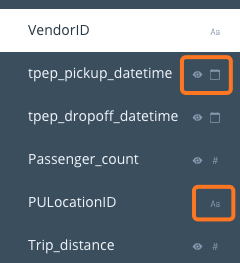
Image 38: Domains Data Types
In Edit Version mode, you can also change the position of the Domains in the browsing panel, by grabbing the handle on the left side of the Domain, and moving it vertically along the list of Domains.
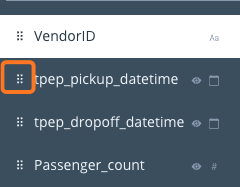
Image 39: Domain List Rearrange
Let’s take a look at how you can add a Domain.
Add Domain
In order to add Domains in HEDDA.IO, you must switch to the Edit Version mode, which is done by clicking the Edit Version button in the top-right corner of the page. Once there, click on the Domains tab in the navigation bar.
The Add Domain button is then located at the top of the Domains Browsing Panel. The button is, of course, only visible in Edit Version mode.
Clicking on the “Add Domain” button, opens the Add Domain panel.
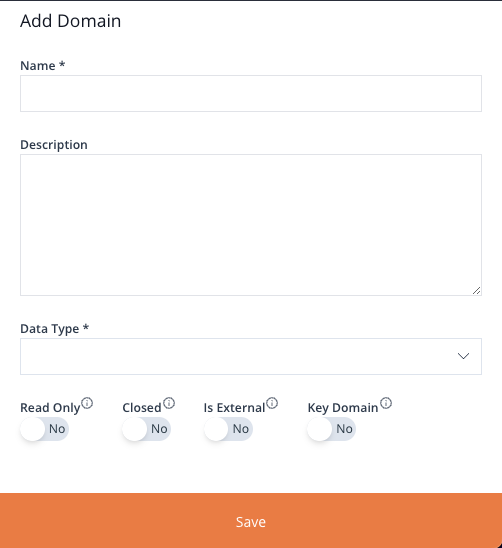
Image 40: Add Domain Form
This panel has three text inputs and four switches:
- Name
- Description
- Data Type
- Four Switches
- Read Only – this means that no Member check will be performed for this Domain.
- Closed – this means that only Members already defined for this Domain can be valid.
- Is External – means the Members are loaded from an external source.
- Key Domain – means the Domain is an identifier or part of a combined identifier for a tuple. Only meta information.
There are currently four data types supported for the Domains:
- String
- Number
- Boolean
- Date
When selecting data type String, two additional inputs will appear allowing you to enter the Length of the value and the Algorithm.
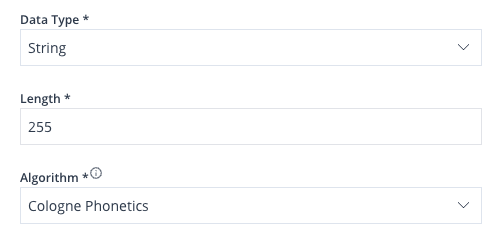
Image 41: Add Domain – String Options
Algorithms
Here’s an overview of all the Algorithms currently available in HEDDA.IO.
| Algorithm | Description |
|---|---|
| Cologne Phonetics | The Cologne Phonetic (also known as Kölner Phonetik) is a Phonetic Algorithm that assigns a sequence of digits to words according to their sound, the phonetic code. This procedure aims to assign the same code to words with the same sound to implement a similarity search for search functions. |
| Levenshtein | Levenshtein Distance is a string comparison method between two strings or sequences. Unlike other methods such as Cologne Phonetic, it measures the distance between two strings and not the phonetic sound. |
| Double Metaphone | Contrary to the original algorithm “Metaphone” (Wikipedia) whose application is limited to English only, this version takes into account spelling peculiarities of several other languages. |
| Jaro | Jaro or Jaro-Winkler is a string method that compares two strings or sequences. Unlike other methods such as Cologne Phonetic, it measures the distance between two strings and not the phonetic sound between them. |
| Longest Common Substring | The Longest Common Substring algorithm is to find the longest string (or strings) that is a substring (or are substrings) of two or more strings. |
| Caverphone | The Caverphone algorithm is based on a similar concept as the Metaphone algorithm and can be used to match english names but also general english words. |
| NYSIIS | The New York State Identification and Intelligence System Phonetic Code, commonly known as NYSIIS, is a Phonetic Algorithm devised in 1970 as part of the New York State Identification and Intelligence System. It features an accuracy increase of 2.7% over the traditional Soundex algorithm. |
| Phonem | The Phonem algorithm mainly targets german names. |
| Phonetex | The Phonetex algorithm works best in matching words that sound alike but are spelled differently in the english language. It is an improvement over the Soundex algorithm. |
| Phonex | Phonex is an adaption of the Soundex Algorithm. It has an increased performance when used for the english language. |
| Phonix | Phonix is an extension of the Soundex Algorithm. It has been found to be particularly useful when applied to personal names in a multi-lingual environment. |
| Exact Match Case Insensitive | Checks if two strings are identical to each other without case sensitivity. |
| Exact Match | Checks if two strings are identical to each other with case sensitivity. |
| Levenshtein-Damerau | Extends the Levenshtein Algorithm by allowing more operations to calculate the string distance. It will be less than with the Levenshtein Algorithm and can be useful, e.g., for human misspellings. |
| Keyboard Distance | Calculates the distance between two strings based on the chosen Keyboard layout. The closer keys are on the chosen Keyboard Layout, the smaller is their distance. |
Selecting the Number data type, will make 2 additional inputs visible, allowing you to enter the precision and the scale. This will also automatically set the Read Only switch on, given that for number Domains it is unlikely to have Members or Synonyms defined.
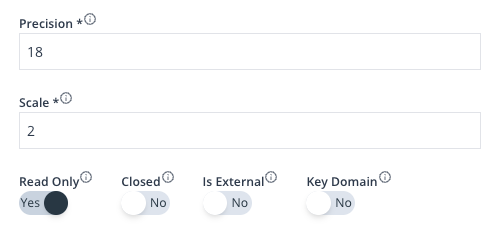
Image 42: Add Domain – Number Options
Is External
Switching the Is External switch on, will allow you to connect to an already configured External Connection from there.
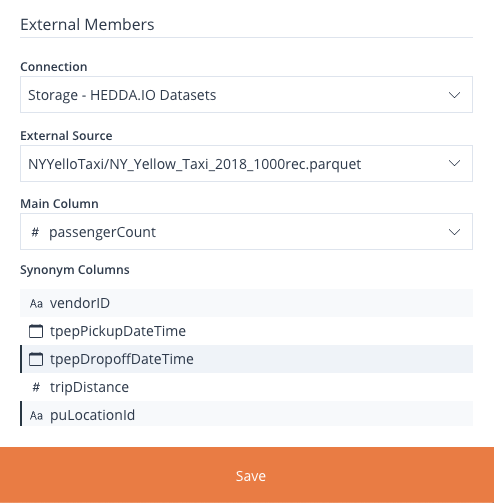
Image 43: Member Search Form
This will make the External Members section visible, which contains 3 dropdown inputs and a list input:
- Connection – select an existing External Connection.
- External Source – select the path to the dataset within the connection.
- Main Column – select the column you need it to act as the source for main Members.
- Synonym Columns (list) – select the column/s you need to act as Synonym Members for the main column selected above. A simple click will select the column, and a second click will unselect it.
Click the Save button once you finish the setup.
Members Panel
The roster of Members in the Members List encompasses the Main Member’s value as well as their corresponding Synonyms, accompanied by selected attributes such as Status and Validation Status.
Directly above the list, you’ll encounter a search input labeled Search Member, enabling you to locate a Member by its specific name.
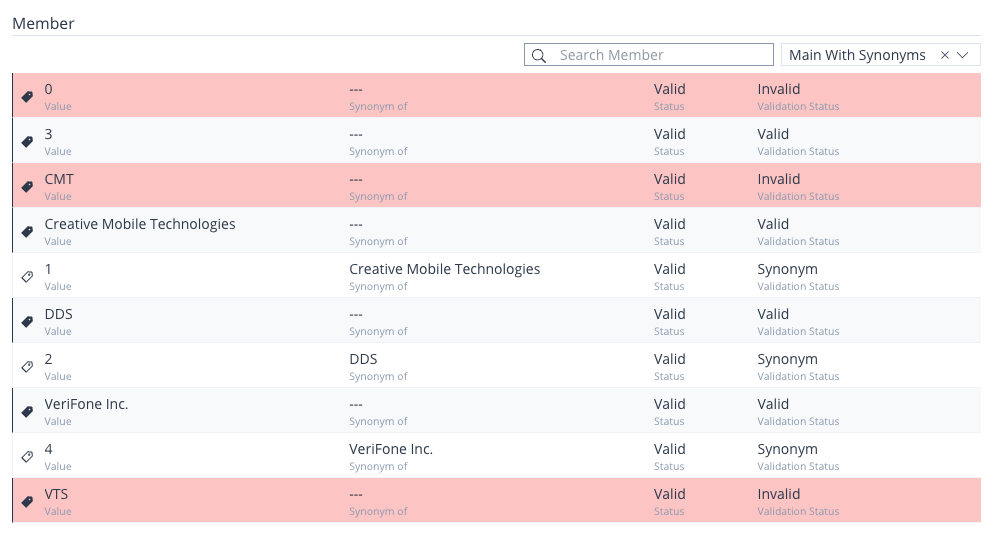
Image 44: Member List
Adjacent to this input, there is a filter dropdown, providing the option to sort the Members list based on:
- Is Main
- Main with Synonyms
- Valid
- Invalid
- New
To remove the filter, simply hover over the filter dropdown and click the small x icon that emerges to the right of the chosen value.
Each Member is accompanied by a small tag icon on the far right side. The black tag signifies Main Members, while the white tag indicates Synonyms.
Add/Edit/Delete Members
In order to add Members to Domains in HEDDA.IO, you must switch to the Edit Version mode, which is done by clicking the Edit Version button in the top-right corner of the page.
Once in the Edit Version mode, click the Domains tab and select the Domain you want to add Members to. You’ll notice the Add Member button located at the upper-right corner of the Members Panel.
Selecting this button will prompt the appearance of the Add Member panel, which offers 3 methods for adding Members to the Domain:
- Add Member Manually
- Import from Excel
- Import Stage
In the following sections, we will elaborate on each of these options, explaining their respective functionalities.
Add Members Manually
This functionality enables you to incorporate Members individually, along with any associated Synonyms if applicable.
All these actions can be easily performed within a user-friendly dialog interface.
The Value input signifies the value within the corresponding Domain.
Within the center of the panel, you’ll find two tabs labeled Main and Synonym. By clicking these, you can transition to distinct input sets. These buttons are utilised to specify the type of Member being added.
When in the Main tab, you have the capability to select a validation status and input Synonyms to the value that was entered in the Value input.
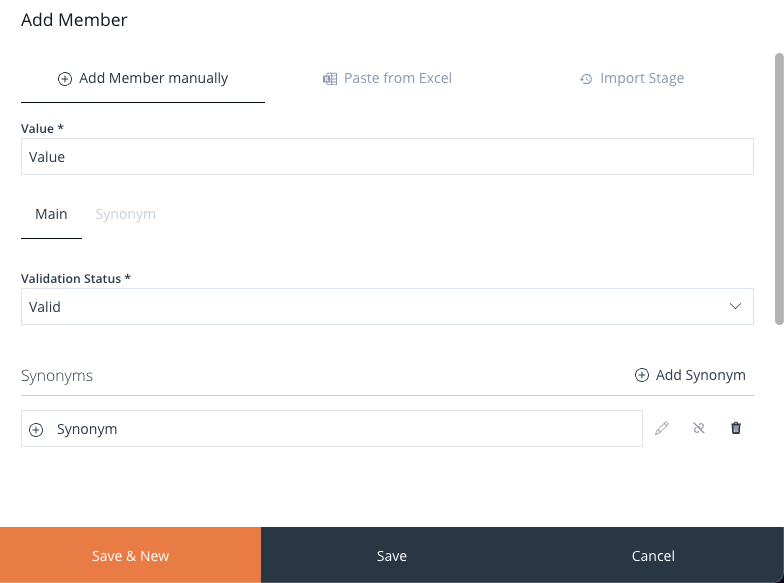
Image 45: Add Member Manually – Main Value Form
To add Synonyms, simply click the Add Synonyms button and input the value for the Synonym. It is possible to also delete and edit Synonyms as needed.
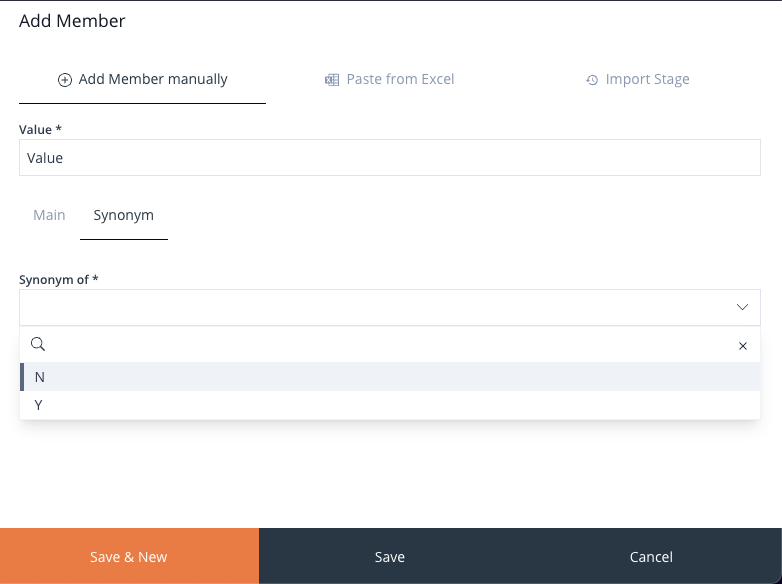
Image 46: Add Member Manually – Synonym Value Form
Conversely, when on the Synonym tab, you will encounter a dropdown labeled Synonym Of. This dropdown enables you to designate the Main Member to which the particular Synonym is associated. The dropdown also has a search input on top of the list of Members, to help you search through longer list of Members.
Paste From Excel
This option allows you to paste entire columns of values from an Excel file.
Once you’ve accessed the “Paste from Excel” tab, simply click within the space shown on the left, then press Ctrl + V on your keyboard.
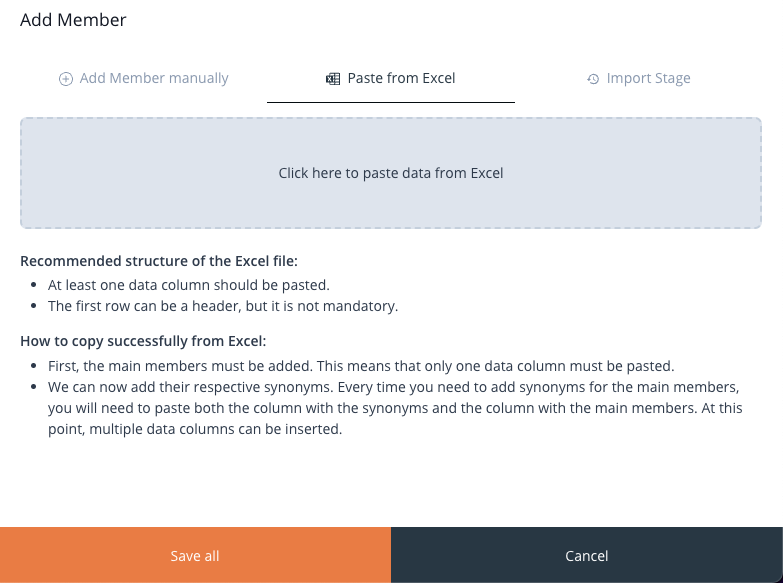
Image 47: Add Member From Excel – Copy Paste Box
The values should be exhibited in the manner illustrated in the image example below.
The Value Column dropdown permits the user to choose from the various data columns that were copied, if applicable. For this instance, only one column was copied, resulting in a solitary column available for display, which is what the dropdown reflects.
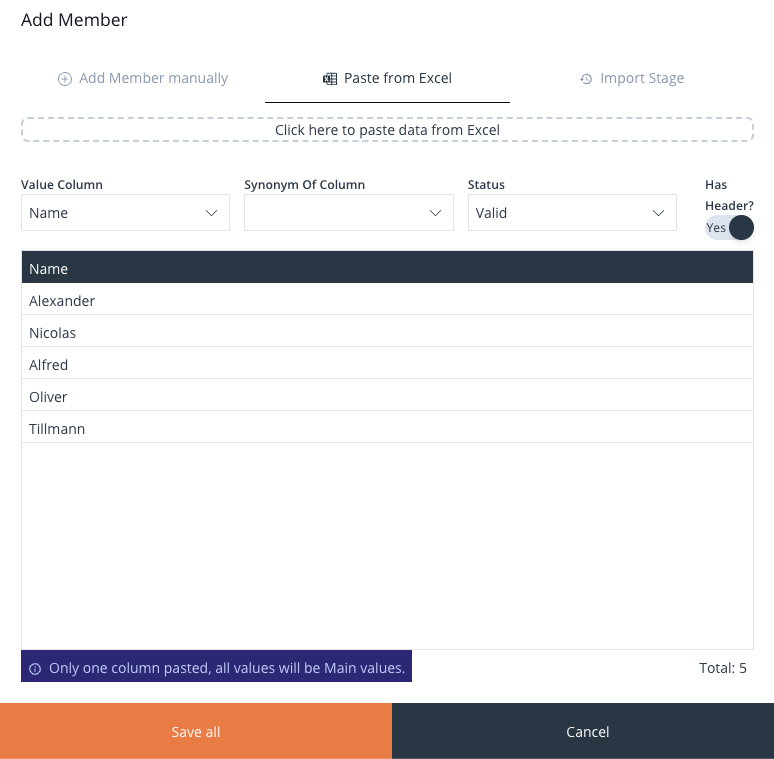
Image 48: Add Members From Excel – Adding Main Values
The Synonym of Column dropdown empowers the user to designate the column containing the primary Members. This feature becomes relevant when the column comprising the primary values has been added beforehand.
When adding the Synonym columns, it is mandatory that you select the column with the main values as well, before pasting the values into the Drag & Drop component.
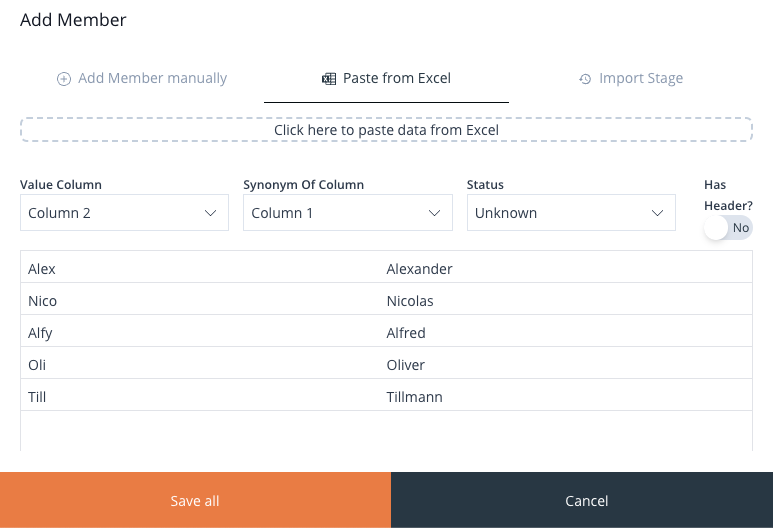
Image 49: Add Members From Excel – Adding Synonym Values
The Status dropdown provides the option to choose between Valid, Invalid, or the default selection of Unknown for the Members.
Lastly, located on the far right side, we find the Has Header slider. When activated, this slider designates the top row of the column as a header, automatically assigning the header names to the copied columns. All this information is also available on each panel itself, with detailed instructions.
Upon completing all necessary configurations, proceed to click the Save All button at the bottom of the dialog.
Import Stage
The Import Stage feature provides you with the ability to import values that have been recently identified in prior Executions. This means that if during previous operations new values were discovered, you can utilise the Import Stage to add these new found values as Members.
Domain Info Panel
To the right side of the page we have the Info Panel which displays information on the selected Domain in the browsing panel.
The panel is split into 3 sections:
- Details
- Used in Business Rules
- Last Modified (in Edit Version mode)
Details
The details section includes the description and the following info, depending on the data type associated with the Domain:
- String
- Data Type
- Length
- Algorithm
- Closed
- Read Only
- Key Domain
- Number
- Data Type
- Precision
- Scale
- Closed
- Read Only
- Key Domain
- Date/Boolean
- Data Type
- Closed
- Read Only
- Key Domain
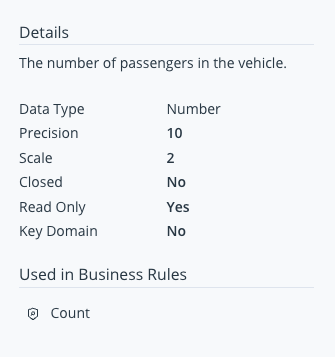
Image 50: Domains Details Panel
Used in Business Rules
This section is only visible in the Edit Version mode, and will list all the Business Rules which are currently using the Domain for Conditions or Actions.
Last Modified
This section will display the name of the user that was the last to make modifications to the Domain, as well as the date on which this occurred.
Edit/Delete Domains
In order to edit and/or delete Domains in HEDDA.IO, you must switch to the Edit Version mode, which is done by clicking the Edit Version button in the top-right corner of the page.
Once there, find and click the Domains tab. Select the Domain you wish to edit or delete. In the top-right corner of the Info Panel, notice the Edit button. Click to open the Edit Domain panel, which allows you to edit the selected Domain in a form similar to the Add Domain form, or delete the Domain by using the Delete button at the bottom of the panel.
Rulebooks
In the Rulebooks section, you’ll encounter a roster of Rulebooks. Each Rulebook is accompanied by its own dedicated Business Rule canvas. This canvas showcases all the Business Rules contained within the corresponding Rulebook, along with illustrating the interconnections among these rules.
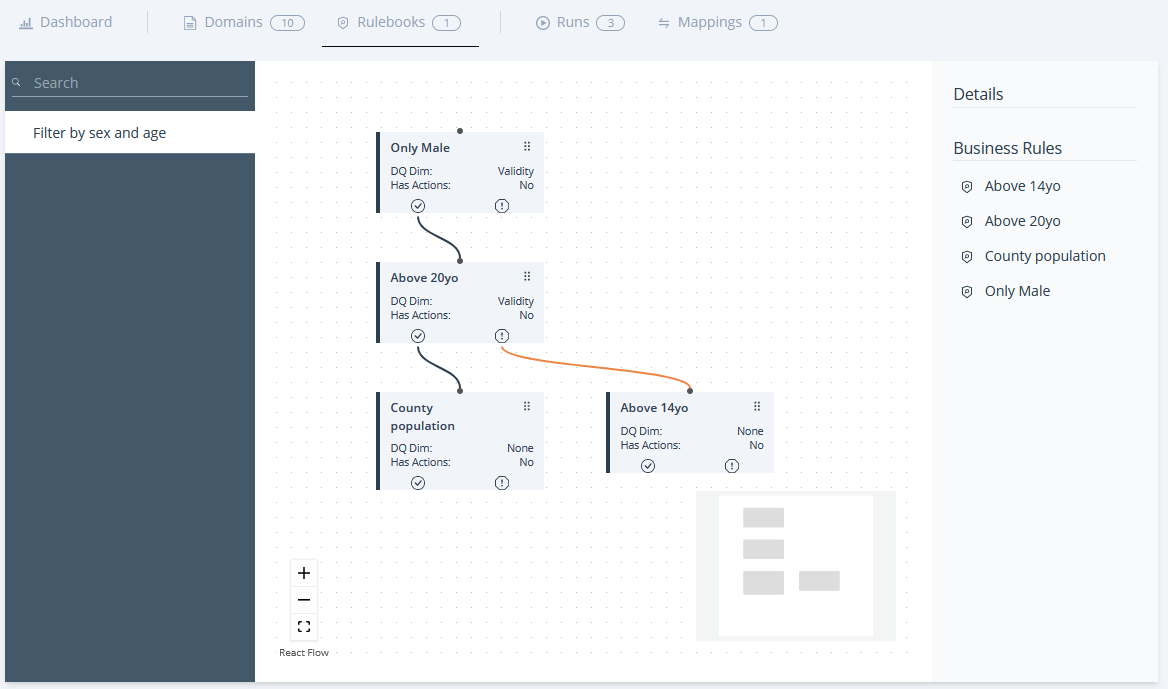
Image 51: Rulebook Dashboard and Canvas
This page is divided into 3 separate panels:
Rulebooks Browsing Panel
The Rulebooks Browsing Panel is positioned along the left side of the page. It encapsulates a list of existing Rulebooks, featuring a search input at the list’s uppermost part. This input enables you to search for Rulebooks with names containing the specific characters you entered.
Add Rulebook
In order to add Rulebooks in HEDDA.IO, you must switch to the Edit Version mode, which is done by clicking the Edit Version button in the top-right corner of the page.
After accessing the Edit Version, navigate to the Rulebooks tab. Here, you’ll find the Add Rulebook button situated at the upper section of the Rulebook Browsing Panel on the left-hand side.
Upon clicking the Add Rulebook button, a panel will slide out from the right. This panel provides you with the option to input a Name and a Description for the newly created Rulebook.
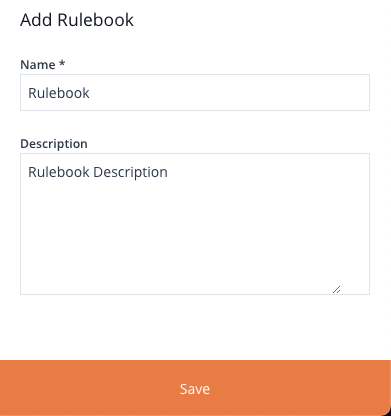
Image 52: Add Rulebook Form
Upon selecting the Save button located at the bottom of the panel, the following actions will occur:
- The Rulebook will be appended to the list of existing Rulebooks.
- A default initial Business Rule will be automatically added to the Rulebook.
- The Edit Business Rule panel will be activated, enabling you to modify the default Business Rule within the Rulebook.
Add Business Rule to Rulebook
The Add and Edit Business Rule panel share the same form.
The panel is split into 3 distinct sections:
- Business Rule Metadata
- Conditions
- Actions
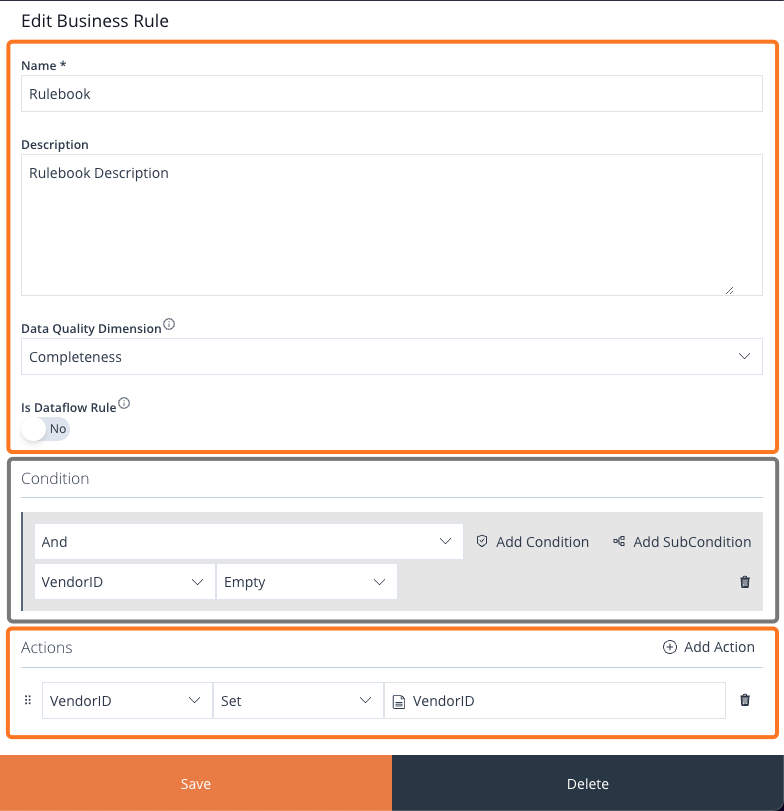
Image 53: Add/Edit Business Rule Form
Metadata
In the Metadata sections, we have 4 inputs:
- Name
- Description
- Data Quality Dimension (dropdown)
- Is Dataflow Business Rule (toggle slider) – If enabled, this Business Rule will not determine if a row is valid or not.
Condition
This section of the panel is where the Business Rule Conditions are defined:
- First, select the operator
AndorOr. - Click on
Add Condition - Select a Domain
- Select a Condition
- Enter a Value (the value can be another column)
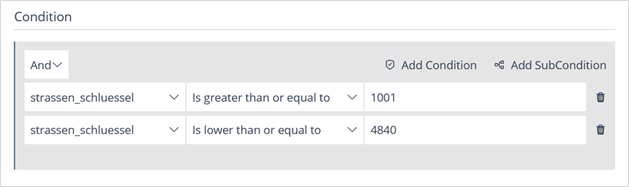
Image 54: Business Rule Form – Conditions
Repeat the process for every additional Business Rule. You can also add Sub-Conditions which will nest inside the existing Conditions.
Here is a list of Conditions that are available for selection, depending on the type of Domain you select when configuring a Condition.
| Condition | Description |
|---|---|
| And | All Conditions must be met. |
| Or | At least one Condition must be met. |
| Contains | Text must contain the value. |
| Has Date format | Can be Parsed as Date. |
| Ends with | Text ends with the value. |
| Is equal to | Both values must be equal (True/False, true/false or 1/0 for bool). |
| Is greater than | Left value must be greater. |
| Is greater than or equal to | Left value must be greater or equal. |
| Is one of | Value must be one of the comma separated sequence. |
| Has exact length of | Text must have the exact number of characters. |
| Is lower than | Left value must be lower. |
| Is lower than or equal to | Left value must be lower or equal. |
| Has maximum length of | Text must not exceed the maximum number of characters. |
| Has minimum length of | Text needs the minimum number of characters. |
| Is not equal to | Both values must not be equal. |
| Is none of | Value must not be one of the comma separated sequence. |
| Is not null | Value is not NULL. |
| Not Matches pattern | Text must not match the pattern. |
| Not Matches Regex | Text must not match the Regex pattern. |
| Is null | Value is NULL. |
| Matches pattern | Text must match the pattern. |
| Matches Regex | Text must match the Regex pattern. |
| Starts with | Text starts with the value. |
The Value can also be equal to the value from another Domain in the same Knowledge Base or a value within a Lookup. To do so, simply write
@, a dropdown will then present you with a list of the available Domains and Lookups to choose from. See the screenshot below.
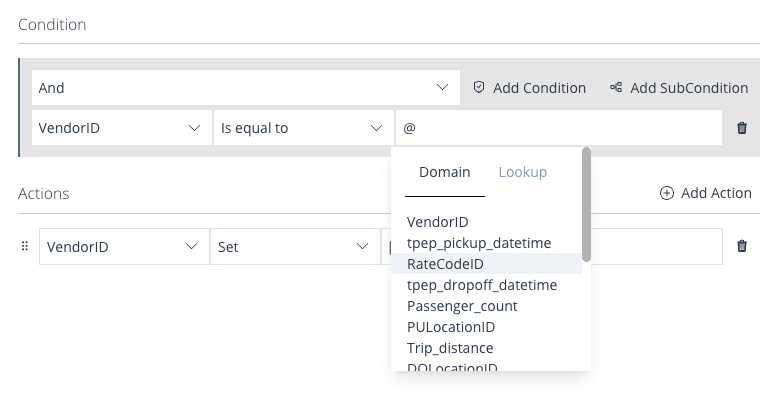
Image 55: Business Rule Form – Conditions – Dynamic Values
Actions
In this section of the panel, you can add Actions, which will be triggered whenever the value in the respective Domain will meet all Conditions of the Business Rule.
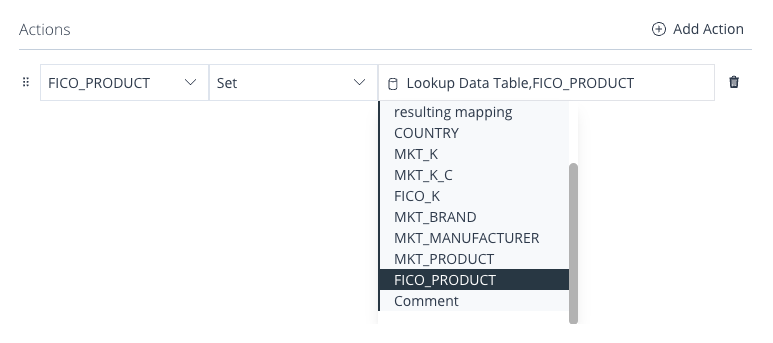
Image 56: Business Rule Form – Actions – Dynamic Value
To add an Action, simply click the Add Action button located on the right side.
A new Action will be appended below, providing you with the ability to choose the Domain on which you wish to execute an Action.
The second input presents itself as a dropdown menu and provides you with a range of Action-Types to select from:
- Set
- Append
- Prepend
- Trim Left
- Trim Right
- Trim
- To Lower
- To Upper
- Replace
- Substring
- Regex Replace
The third input field will only become visible when Actions such as Set, Append, Prepend, Substring, Replace, or Regex Replace are chosen. This field allows you to input a value for the chosen Action.
Similar to Conditions, the @ symbol can always be utilised to designate a Domain or a column from a Lookup.
Concatenation
The order of execution follows the sequence in which actions are listed. The output of one action becomes immediately available for subsequent actions, either as a Domain to be modified or as a value to alter another Domain. This characteristic can be harnessed for performing more intricate operations.
Concatenation Example
By utilising Append and Prepend, it’s possible to extend a Domain of the String type, similar to performing concatenation. To achieve this, an initially empty Domain can be assigned the initial value, and successive Append actions can then append additional literals or Domain values. DataFlow Business Rules offer the capability to append specific values or even omit them.
Alternatively, values can be inserted at the beginning of an existing String Domain using Prepend. However, it’s important to note that Prepend places the value directly in front of the designated Domain, requiring the values to be prepended in reverse order.
The following example would result in a concatenation of the following parameter list: Value 1, Value 2, Other Text Domain, Target Domain, Value 5, Value 6.
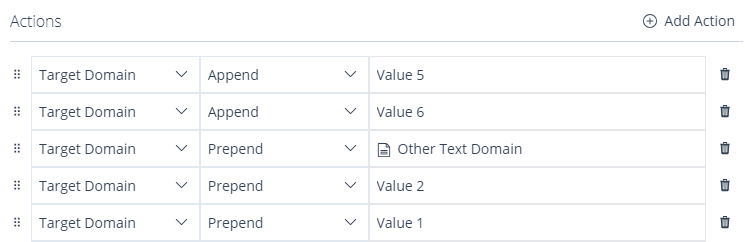
Image 57: Business/ Dataset Rule Form – Actions – Concatenation Example
Add Subsequent Business Rule
Adding a subsequent Business Rule to a Rulebook will require you to link it with the default or an already existing Business Rule. This means that in order to add a Business Rule, you must click on one of the following icons on an existing Business Rule, depending on when you want the rule to be checked and you flow designed.
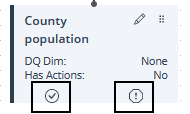
Image 58: Rulebook Canvas – Business Rule
Clicking on the Checkmark icon will have the new Business Rule checked if the previous Business Rule is Valid. Clicking on the Warning icon will have the new Business Rule checked when the previous Business Rule is invalid.
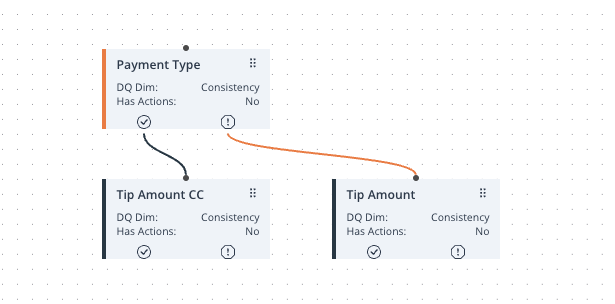
Image 59: Rulebook Canvas – Business Rule Relationship
This approach allows you to construct distinct Business Rule flows tailored to align with your validation procedures.
Rulebook Canvas
The Business Rule canvas presents a diagram-like grid where you can add Business Rules and design the sequence of Business Rules as well as the relationship between them. These rules can be used for both validation purposes and managing data/logic flow. The canvas permits zooming in and out and offers the option to center on the chosen object.
Each Business Rule can be dragged around the canvas and positioned at a desired location.
Rulebook Info Panel
On the far right-hand side, you’ll discover the Info Panel, which displays information related to the selected Rulebook in the Rulebook Browsing Panel.
It is split into two sections, Details and Business Rules.
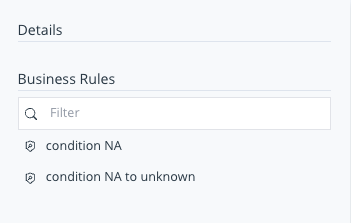
Image 60: Rulebook Info Panel
The Details section contains the description of the Rulebook. The Business Rules section features a list of all the Business Rules on the selected Rulebook canvas.
Business Rule Panel
Clicking on any of the Business Rules in the Rulebook Info Panel or on the names of Business Rules on the Canvas, will navigate you to a menu containing information about the selected Business Rule, including:
- Conditions – This segment presents the Business Rule Conditions and operators in a more condensed format.
- Actions – This segment presents the Actions that have been configured to execute whenever the value within the Domain satisfies the Condition of the Business Rule.
- Details – This segment presents the description of the Business Rule, the Data Quality Dimension it pertains to, and the Group to which the Business Rule is linked.
- Flow – This segment displays the parent rules on the Rulebook canvas.
- Used Domains – This section enumerates all the Domains that were utilised to create Conditions within the Business Rule.
- Last Modified – In this segment, you will find information about the user who last modified the Business Rule, along with the date on which the modification took place.
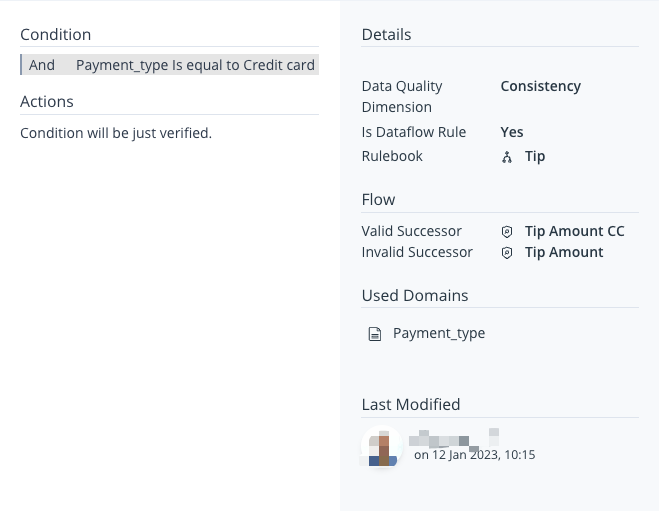
Image 61: Business Rule Panel
You can always click on the Rulebook in the list on the left, to go back to the Rulebook overview.
Edit/Delete Rulebook
In order to edit and/or delete a Rulebook in HEDDA.IO, you must switch to the Edit Version mode, which is done by clicking the Edit Version button in the top-right corner of the page.
Once there, find an click the Rulebook tab. Select the Rulebook you wish to edit or delete. In the top-right corner of the Info Panel, notice the Edit button. Click to open the Edit Rulebook panel, which allows you to edit the selected Rulebook in a form similar to the Add Rulebook form or delete the Rulebook by using the Delete button at the bottom of the panel.
Dataset Rules
This page can be accessed from the Knowledge Base navigation bar, by clicking the Dataset Rules tab.
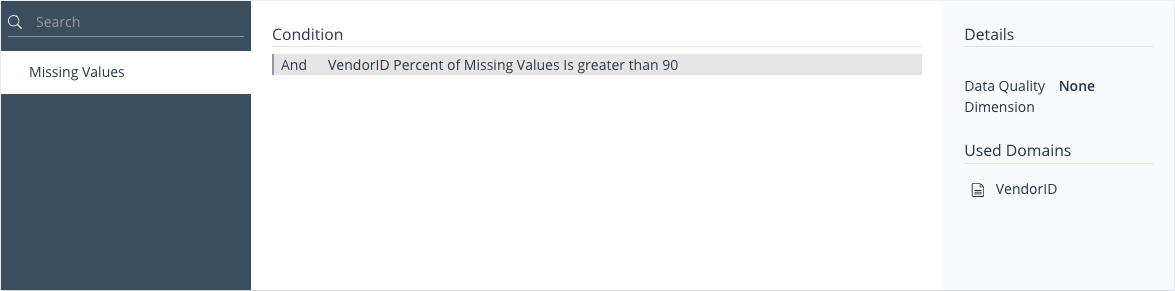
Image 62: Dataset Rules Dashboard
The page is divided into 3 separate panels:
We will take a closer look at each of these sections.
Dataset Rules Browsing Panel
Upon landing on the page, you’ll notice a panel to the left that contains the list of already created Dataset Rules. Positioned above this list is a search input facilitating the quick retrieval of Dataset Rules with names that match the input character/s.
In the Edit Version mode, above of the search input, the Add Dataset Rule button is located.
Add Dataset Rule
In order to add a Dataset Rule in HEDDA.IO, you must switch to the Edit Version mode, which is done by clicking the Edit Version button in the top-right corner of the page.
Once there, find the Dataset Rules tab and click on it to be navigated to the Dataset Rules page. Locate and click the Add Dataset Rule at the top of the Dataset Rules Browsing Panel.
This will open the Add Dataset Rule panel allowing you to configure and create a new Dataset Rule.
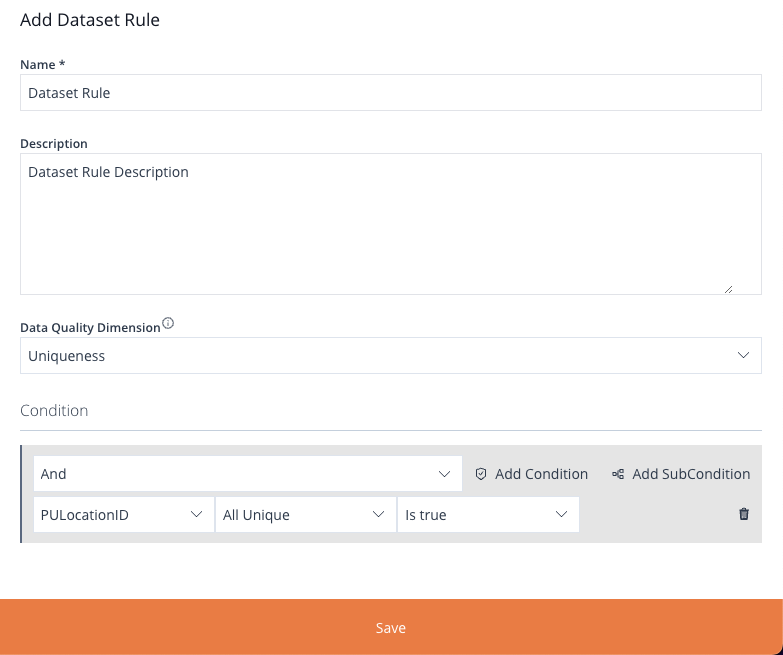
Image 63: Add Dataset Rule Form
The form inside the panel is split into 2 sections:
- Dataset Rule Metadata
- Conditions
Metadata
This section contains the basic information about the Dataset Rule:
- Name
- Description
- Data Quality Dimension
The Data Quality Dimension allows you to categorize the rule based on:
- Completeness
- Uniqueness
- Timeliness
- Validity
- Accuracy
- Consistency
- None
Conditions
The Condition section is quite similar to the one we have in the Business Rules form, with an additional field being the difference.
The additional field allows the values within the Domain to be queried according to specific Conditions. These being:
- Number of Distinct Values
- All Unique
- Maximum String Length
- Minimum String Length
- Median String Length
- Mean String Length
- Number of Missing Values
- Percent of Missing Values
- Number of Valid Values
These are then checked against default Business Rule Conditions.
Dataset Rule Overview
In the middle section, you will find an overview of the Conditions formulated within the chosen Dataset Rule. Each entry within this list features the corresponding operator and Condition.
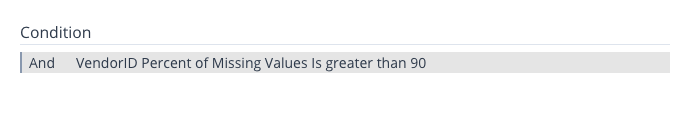
Image 64: Dataset Rule Overview
Dataset Rule Info Panel
On the right-hand side, the Info Panel hosts the Details and Used Domains sections.
The Details section encompasses the description of the Dataset Rule and the associated Data Quality Dimension. The Used Domains section highlights the Domain name on which the Condition was established.
Clicking any of the Domains in the list, will navigate you to the respective Domain on the Domains page.
Edit/Delete Dataset Rule
In order to edit or delete a Dataset Rule in HEDDA.IO, you must switch to the Edit Version mode, which is done by clicking the Edit Version button in the top-right corner of the page.
Once there, find an click the Dataset Rule tab. Select the Dataset Rule you wish to edit or delete. In the top-right corner of the Info Panel, notice the Edit button. Click to open the Edit Dataset Rule panel, which allows you to edit the selected Dataset Rule in a form similar to the Add Dataset Rule form, or delete the Dataset Rule by using the Delete button at the bottom of the panel.
Data Links
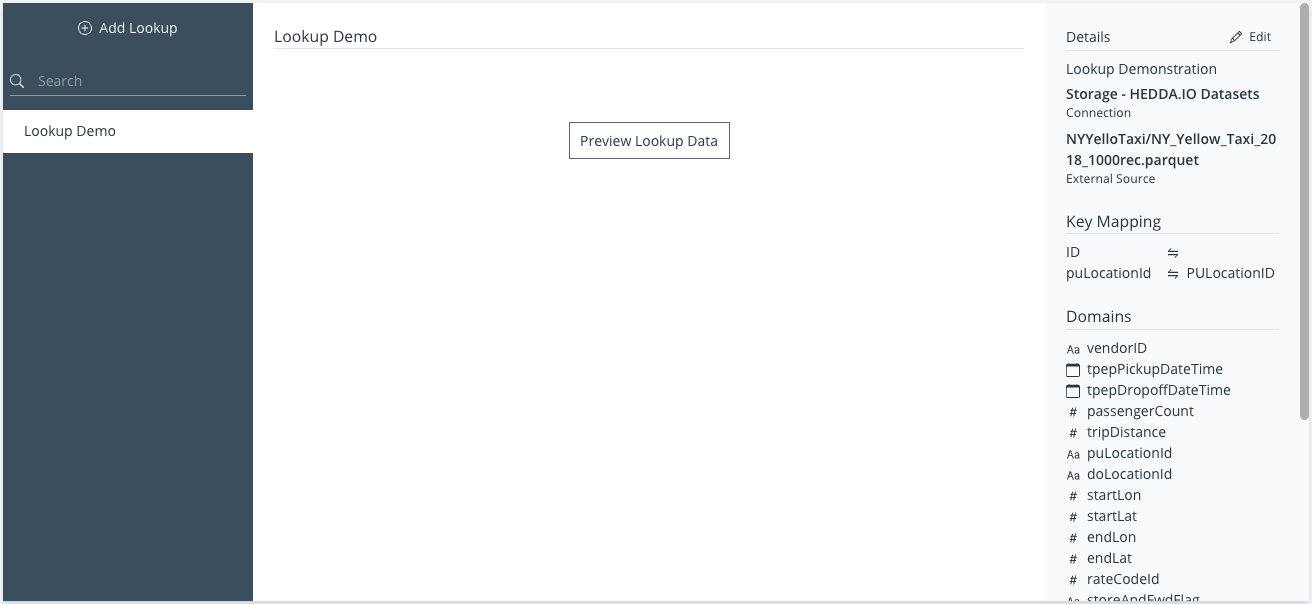
Image 65: Data Links Dashboard
Let’s take a closer look at each of these sections.
Data Link Browsing Panel
Similar to previous pages, upon navigation to the Data Links page, the left-hand panel presents a list of Data Links with a search input just above it.
In the Edit Version mode, above of the search input, the Add Data Link button is located.
Add Data Link
In order to add a Data Link in HEDDA.IO, you must switch to the Edit Version mode, which is done by clicking the Edit Version button in the top-right corner of the page.
Once there, click the Data Links tab in the navigation bar to navigate to the Data Links page.
In the Browsing Panel on the left, click the Add Data Link in the top section. This will open the Add Data Link panel containing a form that will allow you to configure a Data Link using the a predefined External Connection.
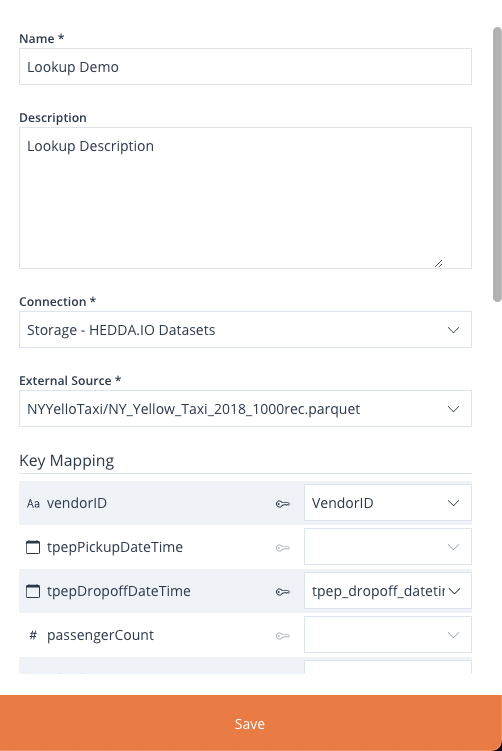
Image 66: Add/ Edit Data Link Form
The form is split into two sections, Data Link metadata and Key Mapping.
Metadata
The metadata section contains the following input fields:
- Name
- Description
- Connection – select the External Connection from the dropdown.
- External Source – From the dropdown, select the path to the file that you want to use as a Data Link.
Key Mapping
Once the file is selected in the External Source dropdown, it will populate the Key Mapping section according to the name of all the columns in the dataset.
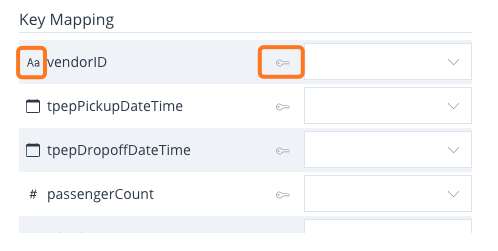
Image 67: Add/ Edit Data Link Form – Key Mapping
Each item in the Key Mapping section has an icon representing the datatype on the left, a Key icon in the middle, which upon being clicked, will mark the column as being an identifier or a key, at which point, the dropdown field on the right will become available, allowing you to map it to an existing Domain.
Once all is configured, click the Save button to save the Data Link and close the panel.
Data Link Overview
In the center, the Data Link data preview includes the Preview Data Link Databutton, which fetches data from the dataset that was selected in the configuration of the Data Link.
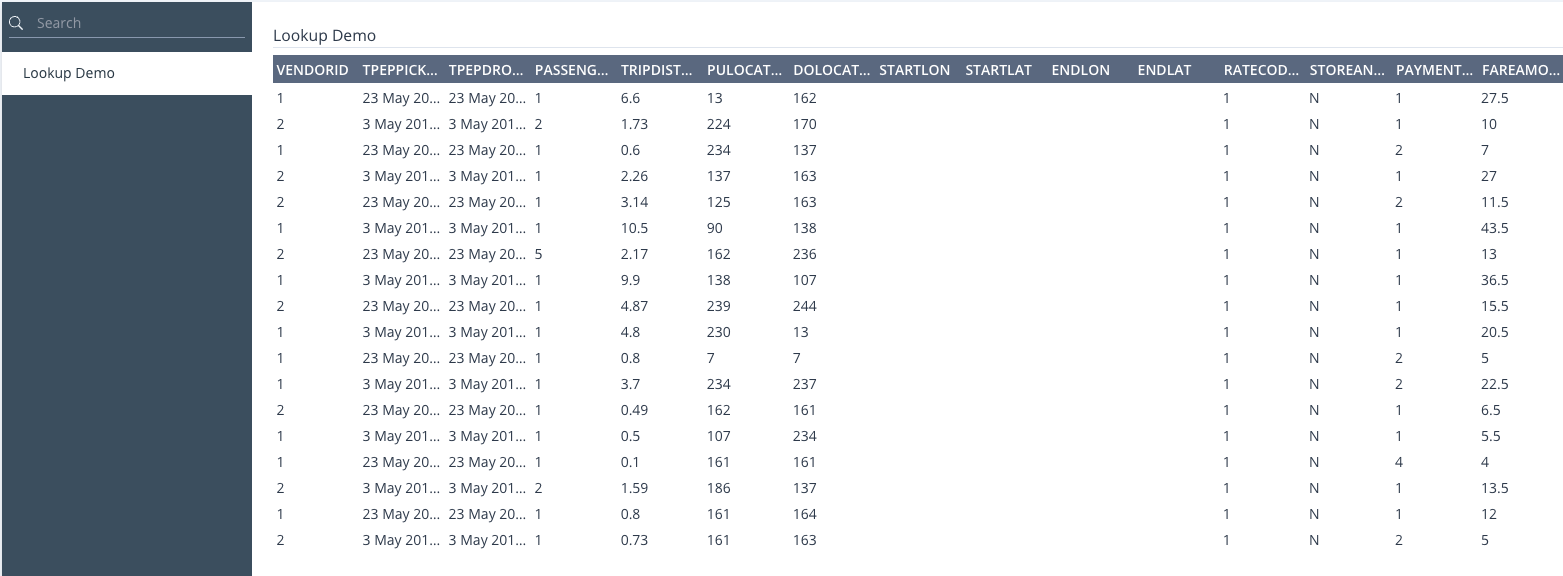
Image 68: Data Link Overview
Data Link Info Panel
On the right side, we have the Info Panel, which is split into 3 sections:
- Details
- Key Mapping
- Domains
The details section encompasses the description, External Connection, and Data Link dataset name.
The Key Mapping section comprises the columns used as keys as well as the Domain associated with it.
The Domains section lists all columns within the Data Link dataset.
Edit/Delete Data Link
In order to edit or delete a Data Link in HEDDA.IO, you must switch to the Edit Version mode, which is done by clicking the Edit Version button in the top-right corner of the page.
Once there, find an click the Data Link tab. Select the Data Link you wish to edit or delete. In the top-right corner of the Info Panel, notice the Edit button. Click to open the Edit Data Link panel, which allows you to edit the selected Data Link in a form similar to the Add Data Link form, or delete the Data Link by using the Delete button at the bottom of the panel.
Runs
This is the section where you can set up a Run, which is necessary when attempting to execute a dataset against a Knowledge Base.
The page is divided into 3 separate panels:
- Runs Browsing Panel
- Runs Overview
- Runs Info Panel
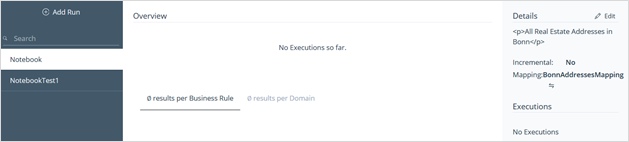
Image 69: Runs Dashboard
Runs Browser Panel
On the left-hand side column, we have the Browsing Panel containing the list of previously created Runs with a search input that allows you to find the Runs based on the input character/s.
In the Edit Version mode, on top of the search input, the Add Run button is located.
Add Run
In order to add a Run in HEDDA.IO, you must switch to the Edit Version mode, which is done by clicking the Edit Version button in the top-right corner of the page.
Once there, click the Runs tab in the navigation bar to navigate to the Runs page.
At the top of the Browsing Panel is the Add Run button. Clicking on the button will open the Add Run panel.
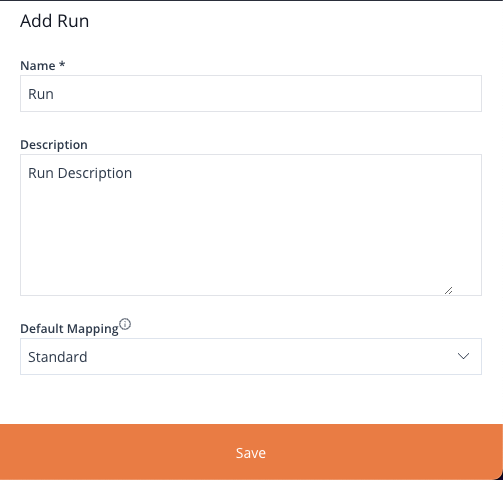
Image 70: Add Run Form
This panel has the following inputs:
- The name of the Run.
- The description of the Run.
- Default Mapping
Once done, click “Save” on the bottom of the panel.
Run Overview
The Overview panel includes the statistics that we can find on the Knowledge Overview. However, while the Knowledge Base overview displays statistics for all Runs, here we have the same statistics but for each Run separately.
The Overview will present pertinent details concerning all Executions up until the current date.
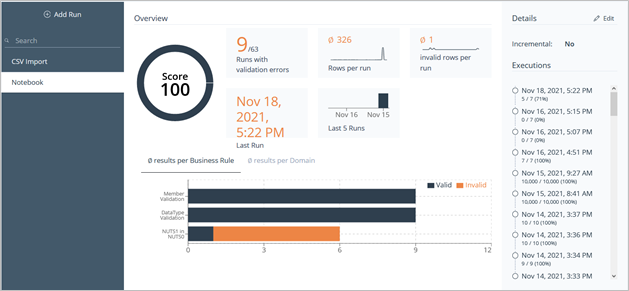
Image 71: Runs Page Overview
Here is an enumeration of the diverse statistics available in the overview:
- Score
- Runs with validation errors
- Rows per Run
- Invalid rows per Run
- Date of the last Run
- Last 5 Runs
Upon hovering over each of these visual elements, detailed information will be unveiled.
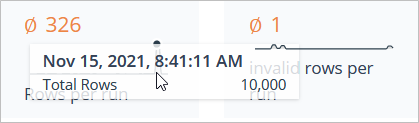
Image 72: Runs Overview Diagram
Towards the bottom of the overview, you’ll encounter three tabs, each housing distinct sets of statistics:
- result per Business Rule
- result per Domain
- result per Dimension
Result per Business Rule
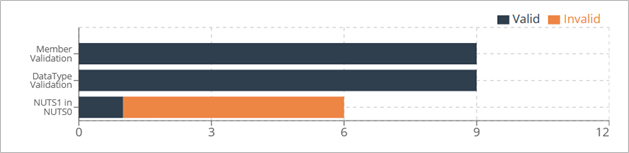
Image 73: Runs Overview Diagram – Result/Business Rules
The Legend clarifies by colours used to denote valid and invalid rows. Subsequently, this section showcases each of the Business Rules utilised in each Execution, presented in an elegantly designed horizontal column diagram.
Result per Domain
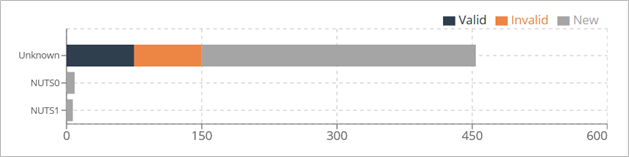
Image 74: Runs Overview Diagram – Result/Domain
The Legend clarifies by colors used to denote valid and invalid entries.
The diagram will sequentially present statistics for columns from the dataset that align with Domains in the Knowledge Base.
Result per Dimension
This panel will exhibit statistics derived from Data Quality Dimensions, provided any were chosen during the configuration of Business Rules.
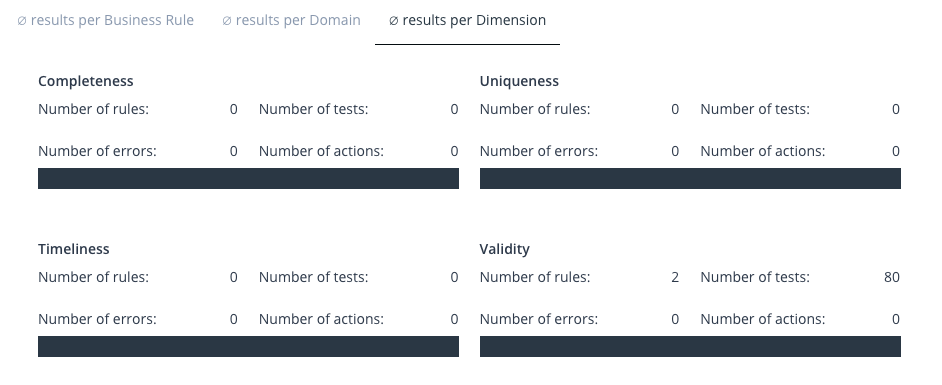
Image 75: Runs Overview Diagram – Result/Dimension
In addition to the count of Business Rules, errors and Actions associated with each Dimension, it will also present the tally of valid and invalid rows per Business Rules. This representation will be depicted by a bar graph, wherein the orange colour denotes valid rules and the blue colour signifies invalid ones.
Run Info Panel
Both the Details and the Executions sections are hosted by the Info Panel located on the right-hand side of the page.
The panel is split into two distinct sections:
- Details
- Executions
The Details section showcases the metadata for the chosen Run.
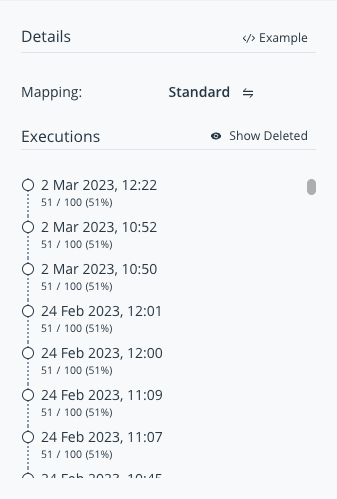
Image 76: Runs Info Panel
The section contains:
- The Description of the Run.
- The name of the Mapping that is being used.
Furthermore, the Example button positioned in the top-right corner furnishes a comprehensive example of how to execute a dataset against the current HEDDA.IO Knowledge Base using the selected Run. The example contains the code for both Python and .NET HEDDA.IO libraries.
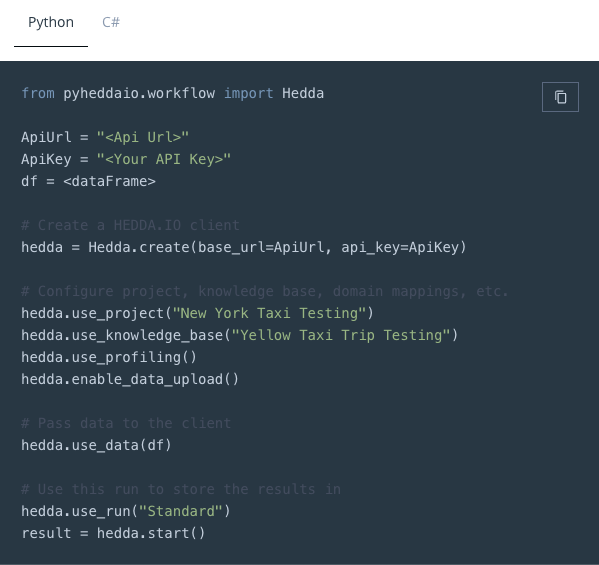
Image 77: PyRunner Example Code
Executions
The Executions section is located below the details section in the Info Panel.
Each item in the list of Executions will have a Date and Time, which represents the moment in time it was executed, as well as the number of valid records / number of total records.
Clicking on any of these Executions in the list, will open an additional panel, which will show advanced info about the Execution.
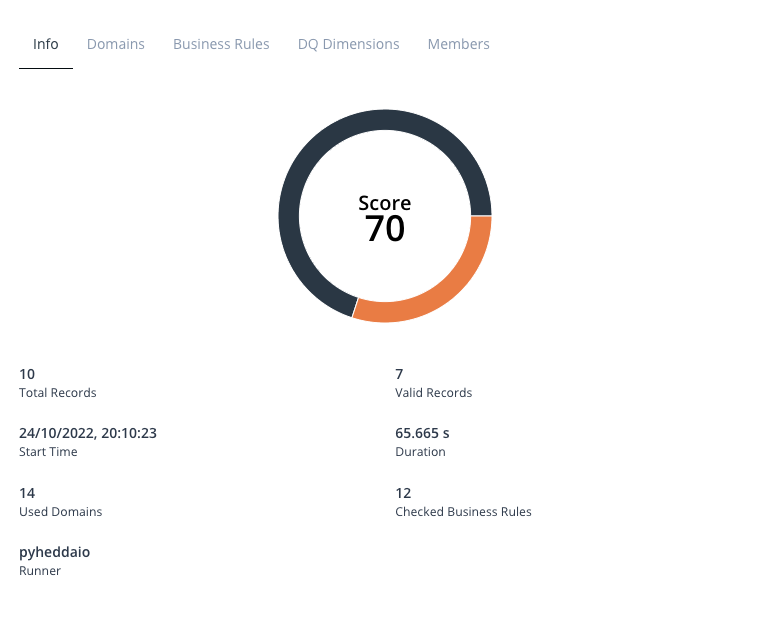
Image 78: Execution Panel – Info
The panel presents you with 6 tabs:
- Info
- Domain
- Business Rules
- Dataset Rules
- DQ Dimensions
- Member
- Profiling
Each containing comprehensive statistics about the Execution.
Info
This tab functions as an Execution overview.
Here is the type of information available on the info tab:
- Score
- Total Records
- Valid Records
- Start Time
- Duration
- Used Domains
- Checked Business Rules
- Runner
Domain Statistics
Here you can find statistics about the Domains used in the Run.
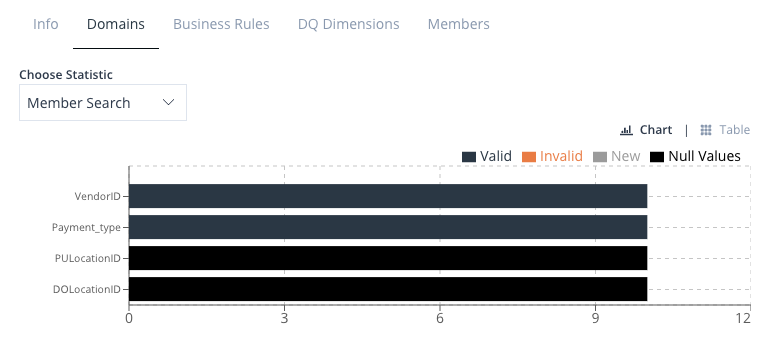
Image 79: Execution Panel – Domains Statistics
At the top, you have the option to view statistics for Members, Data Type Validation, or Value Insights.
You can pick between seeing the statistics as a chat or in a table format on this tab. Just click the buttons on the right side, above the legend, to switch between them.

Image 80: Domains Bar Chart Legend
The Legend is there to assist in understanding the colors used to indicate Valid, Invalid, New, or Null Values when in Chart mode.
Business Rule Statistics
Here are the statistics for every Rulebook and subsequently every Business Rule used in the respective Run.
On the top you will find two drop-downs that will filter the statistics based on different criteria:
- Rulebook
- Exclude Dataflow Rules
The Rulebook dropdown will allow you to see statistics per Rulebook, thus filtering the data based on the selected Rulebook.
Selecting None will only leave the Member and Data Type validation. The Exclude Dataflow Rules dropdown will leave or exclude the Business Rules that were tagged as dataflow rules.
The Legend will help understand which colour was used for the Valid, or Invalid values.
You can pick between seeing the statistics as a chart or in a table format on this tab. Just click the buttons on the right side, above the legend, to switch between them.
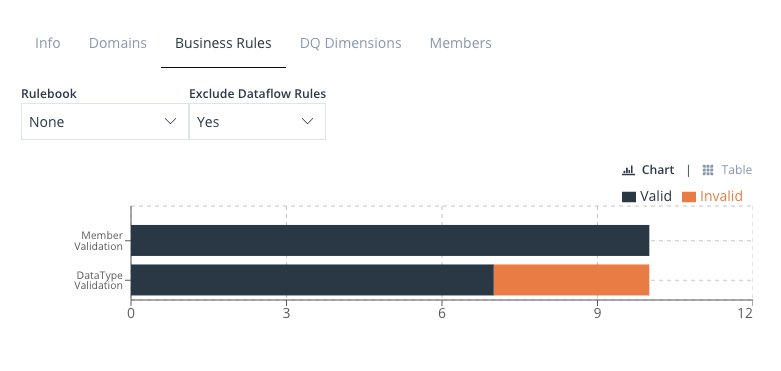
Image 81: Execution Panel – Business Rules Statistics
Data Quality Dimensions Statistics
This tab presents statistics centered around Data Quality Dimensions (DQ Dimensions). This entails that for each Dimension type, it showcases the count of Business Rules with configured dimensions, the number of tests conducted, the portion of those tests encountering errors, and the number of executed Actions.
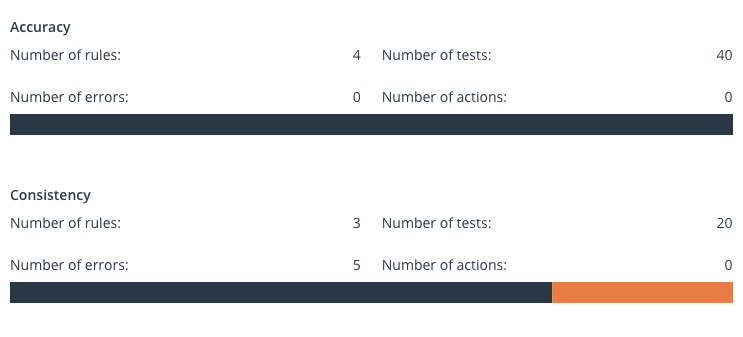
Image 82: Execution Panel – DQ Dimensions Statistics
Member Statistics
In this tab, statistics are compiled for all Members that are found, matched, and new.
At the top, you can opt to exclusively view Members associated with a particular Domain. Additionally, you have the ability to filter the statistical data according to the following criteria:
- New
- New with match
- New without match
- Matched
- All
The horizontal column diagram will present Members based on the selected filter.
You have the choice to view the statistics either as a chart or in a table format on this tab. Simply click the buttons situated on the right side, above the legend, to switch between these display formats.
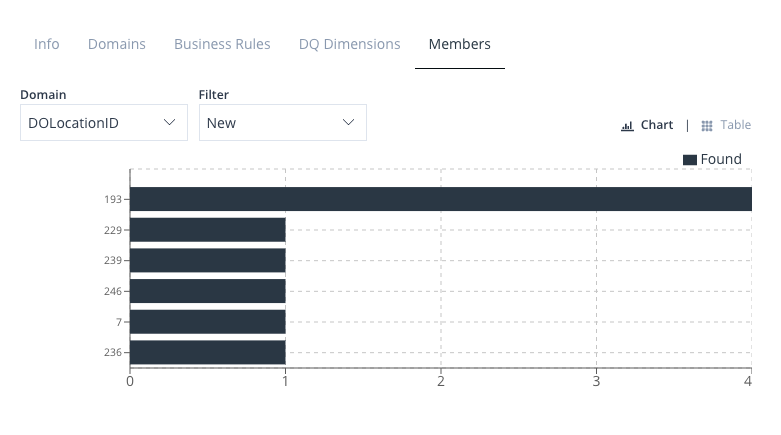
Image 83: Execution Panel – Members Statistics
The Legend exhibits a single color that signifies the Found items.
Profiling
This statistics tab will only show if the Python HEDDA.IO was used in the Run.
This tab includes by far the most statistical data, however, this data is mostly insights into the structure, relationships, and overall characteristics of the dataset. It allows studying data for easy analysis.
The open-source tool pandas-profiling helps craft comprehensive data reports. Click on pandas-profiling to read more.
Reviewing the Profiling report allows you to identify data anomalies and comprehend the essential actions required for data cleansing and preparation.
For instance, the ultimate dataset version will be free of duplicated information. This enables the identification of missing values, identical data entries, incorrect data types, or any other data-related issues. The report facilitates the task of fulfilling all the criteria on the data cleaning and preparation checklist.
Profiling statistics in HEDDA.IO includes statistics such as:
| Component | Description |
|---|---|
| Domains | Which columns contain what |
| Correlations | Mean, average, etc. |
| Missing | Tells you about how your data is distributed |
| Alerts | Again, for visualizing distributions |
| Samples | Allows you to see what is related |
At the very top of the Profiling panel, you can see data related to the Memory Size, Record Size, and Missing Cells.
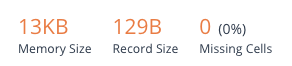
Image 84: Profiling Header
Let’s take a closer look at the components.
Profiling – Domains
This part of the report provides an extensive examination of all the columns within the dataset.
The statistics displayed differ based on the data type of the Domain. The Domain can be selected from the dropdown located above the statistical data. This encompasses, for instance:
- Overview
- Distinct values/percentage
- Missing cells/percentage
- Unique values/percentage
- Memory Size
- Characters and Unicode
- Total Characters
- Distinct Characters
- Distinct Categories
- Distinct Script
- Distinct Blocks
- Length
- Max length
- Min Length
- Median Length
- Mean Length
- Samples
Profiling – Correlations
Correlations refer to the statistical measure of the strength and direction of a relationship between two or more variables.
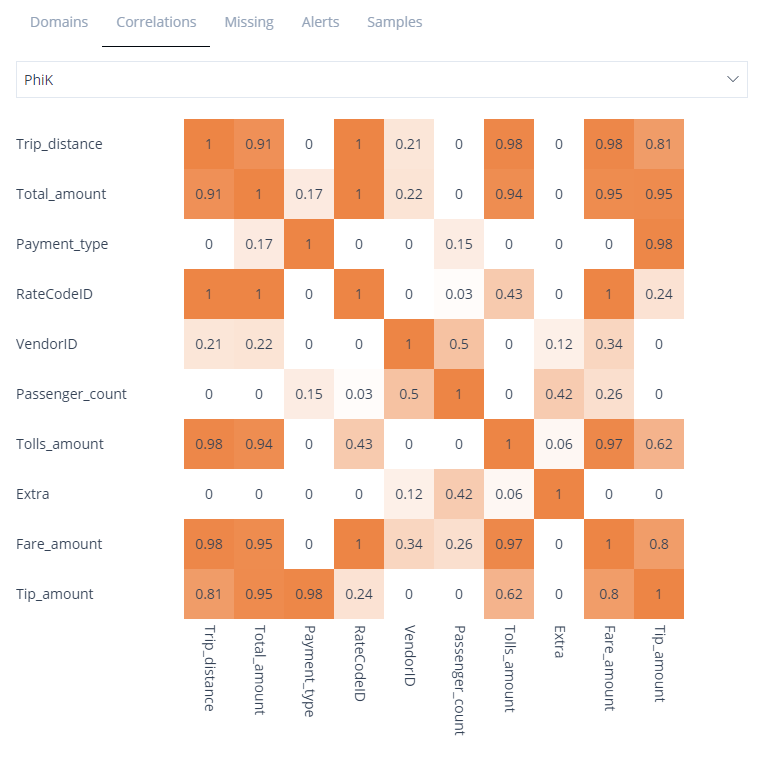
Image 85: Profiling Correlations
A threshold of 1 signifies a strong correlation, while lower values indicate weaker correlations.
You have the option to select from various correlation types:
Profiling – Missing
This section displays visualizations of the missing values within the dataset.
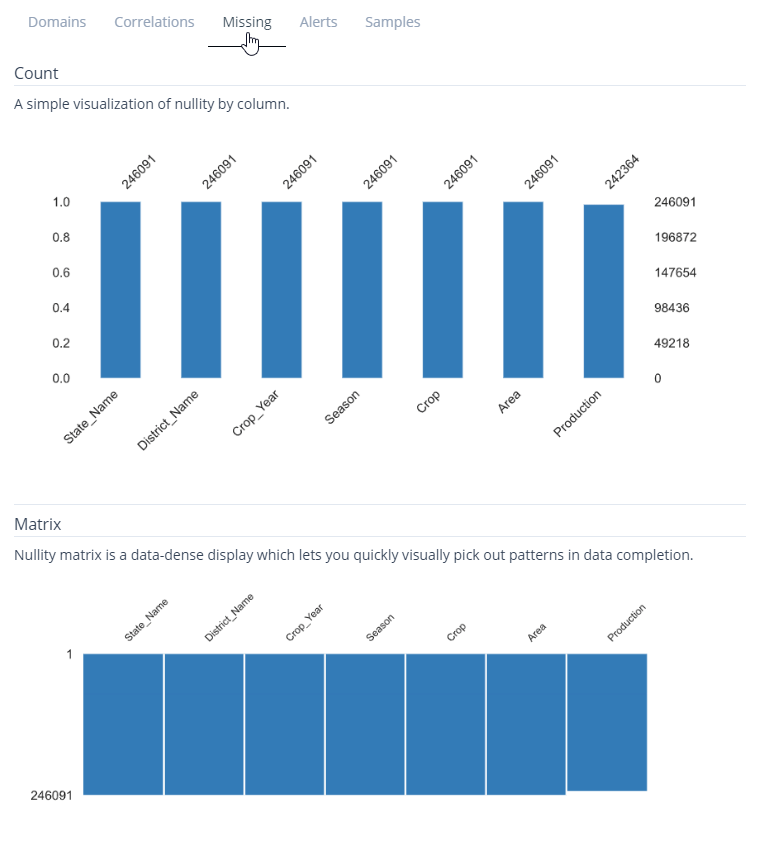
Image 86: Profiling Missing
There are two types of charts: Count and matrix. The count chart is a simple bar chart where the x-axis represents the column names, and the y-axis indicates the number of values present (excluding null values), depicted by the length of the bars.
The same principle applies to the matrix chart.
Profiling – Alerts
The Alerts segment within the report provides an extensive compilation of potential data quality concerns. However, to confirm whether an alert indeed signifies a data quality problem, Domain validation is necessary.
The table provided below outlines all conceivable data quality alerts and their implications. Certain warnings pertain to individual columns, some relate to correlations between columns, and others encompass the entire dataset.
| Alert | Description |
|---|---|
| Constant | Column only contains one value. |
| Zeros | Column only contains zeros. |
| High Correlation | Correlations (either Spearman, Cramer, Pearson, Kendall, PhiK) are above the warning threshold (configurable). |
| High Cardinality | Whether the column has more than 50 distinct values. Threshold is configurable. |
| Skewness | Column’s univariate distribution presents skewness. Threshold value is configurable. |
| Missing Values | Column has missing values. |
| Infinite Values | Column has infinite values (either np.inf or -np.inf). |
| Unique Values | All values of the column are unique (count of unique values equals column’s length). |
| Date | Column contains Date records. |
| Uniform | Column follows a uniform distribution (Chi-squared test score > 0.999, threshold score is configurable). |
| Constant length | For strings/date columns whose entries all have the same length. |
| Rejected | Variable has mixed types or is constant (thus not suitable for meaningful analysis). |
| Unsupported | Column can’t be analyzed (type is not supported, has mixed types, has lists/dicts/tuples, is empty, wrongly formatted). |
| Duplicates | Dataset-level warning signaling the presence of more than 10 duplicated records. |
| Empty | Dataset-level warning signaling there is no data to be analyzed. |
Profiling – Samples
This section displays the first and last ten rows of the dataset.
Edit/Delete Run
In order to edit and/or delete a Run in HEDDA.IO, you must switch to the Edit Version mode, which is done by clicking the Edit Version button in the top-right corner of the page.
Once there, find and click the Runs tab. Select the Run you wish to edit or delete. In the top-right corner of the Info Panel, notice the Edit button. Click to open the Edit Run panel, which allows you to edit the selected Run in a form similar to the Add Run form, or delete the Run by using the Delete button at the bottom of the panel.
Mappings
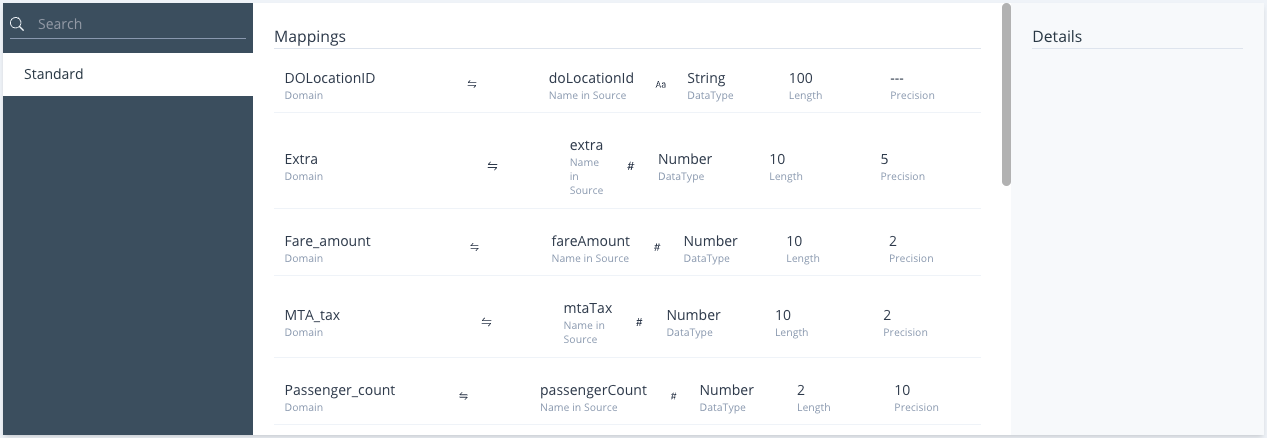
Image 87: Mappings Dashboard
The page is divided into 3 separate panels:
- Mapping Browsing Panel
- Mapping Overview
- Mapping Info Panel
Mapping Browsing Panel
Upon landing on the page, you’ll observe the customary left-hand column containing the list of pre-established Mappings. Positioned above this list is a search input that will help you find Mappings whose names align with the input character/s.
In the Edit Version mode, on top of the search input, the Add Mapping button is located.
Add Mapping
In order to add a Mapping in HEDDA.IO, you must switch to the Edit Version mode, which is done by clicking the Edit Version button in the top-right corner of the page.
Once there, click the Mappings tab in the navigation bar to navigate to the Mappings page.
Clicking the Add Mapping button located on top of the Browsing Panel will open the Add Mapping panel. The panel contains a form that will allow you to configure a Mapping to be used for the Run.
The form is split into two sections:
- Mapping Metadata
- Domain Mappings
Metadata
This section allows you to enter the name and the description of the Mapping.
Domain Mapping
On the bottom side of the form is where we can configure our Mapping. Clicking the Copy Existing will allow you to copy the Mapping configuration from an already existing Mapping. Right under the “Select Domain” label, you have a list of the available Domains listed horizontally.
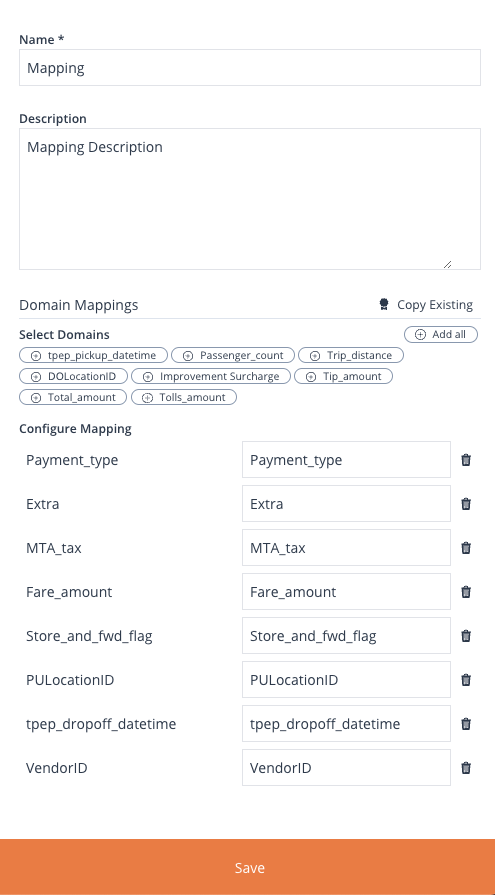
Image 88: Add/ Edit Mapping Form
Clicking on each of them, will add the respective Domain to the `Configure Mapping” label. Alternatively, you can click the Add All which will add all Domains.
If the column name in the dataset and the Domain in HEDDA.IO coincide, the Domains will require no editing. Alternatively, you will need to manually enter the name of the column associated with the selected Domain.
You can click the trashcan icon on the right of each item, in order to remove it from under the Configure Mapping label.
Once all is configured, click the Save button at the bottom of the panel to save and close the panel.
Mappings Overview
In the middle section you have the list of mapped Domains along with their respective data type, length and precision, if the case.
Mappings Info Panel
On the right-hand column, we have the details section containing the description of the Mapping.
Edit/Delete Mapping
In order to edit and/or delete a Mapping in HEDDA.IO, you must switch to the Edit Version mode, which is done by clicking the Edit Version button in the top-right corner of the page.
Once there, find an click the Mappings tab. Select the Mapping you wish to edit or delete. In the top-right corner of the Info Panel, notice the Edit button. Click to open the Edit Mapping panel, which allows you to edit the selected Mapping in a form similar to the Add Mapping form, or delete the Mapping by using the Delete button at the bottom of the panel.
Thanks for reading, and we hope this documentation helps you to navigate HEDDA.IO with ease. If you haver any questions, don’t hesitate to contact us.
Documentation Outline
Click the arrows to expand/collapse content.